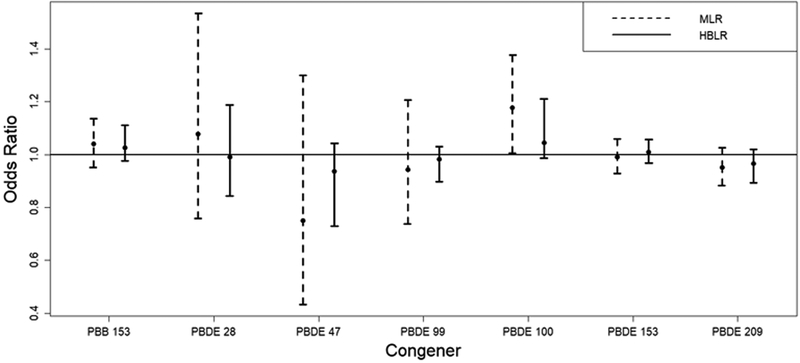
Figure 1.
Parameter estimates and 95% confidence/credible interval results from the standard multiple logistic regression (MLR) analysis and the hierarchical Bayesian multiple logistic regression (HBLR) analysis. Posterior means and quantile-based credible intervals are displayed for HBLR. The odds ratios represent the increase in odds for an interquartile range increase in exposure.

