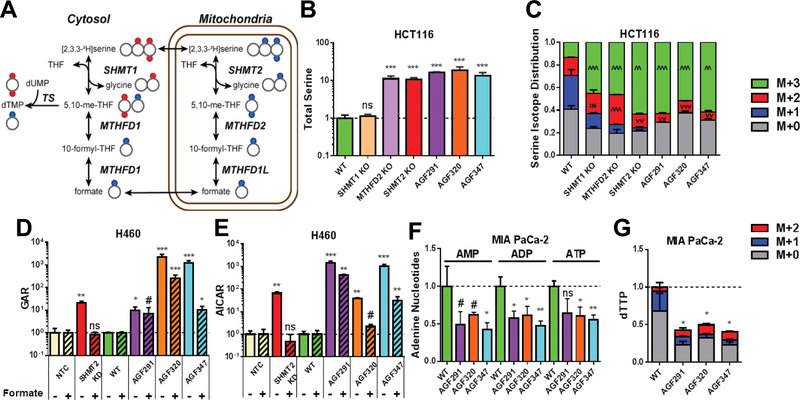
Figure 4. Targeted metabolomics analysis to identify intracellular enzyme targets of AGF291, AGF320, and AGF347.
A: A schematic of serine isotope scrambling and dTTP isotope analysis is shown. Heavy (2H) atoms in serine (red circles) enter the C1 flux in the cytosol through reversal of the SHMT1 reaction and TS leading to dTMP and dTTP (as M+2). In the mitochondria, 2H atoms in serine (blue circles) are metabolized via SHMT2, MTHFD2, and MTHFD1 to formate which is converted to 10-formyl-THF and 5,10-me-THF, leading to dTMP and dTTP (as M+1). Most steps are reversible as noted. Adapted from (22). B and C: Total serine pools (B) and the corresponding serine isotope distributions (C) for WT and KO HCT116 sublines, and for inhibitor-treated WT cells, are shown. D and E: Total GAR (D) and AICAR (E) pools are shown for WT and SHMT2 KD H460 sublines, including inhibitor-treated WT cells, with and without 1 mM formate. F and G: Relative adenine nucleotide pools (AMP, ADP, and ATP) and dTTP pools with isotope distributions are shown for untreated and inhibitor-treated MIA PaCa-2 cells. For D and E, results for inhibitor-treated and SHMT2 KD cells were normalized to vehicle-treated WT ± formate or NTC ± formate samples, as appropriate. Data are mean values +/− standard deviations for three technical replicates. #, p < 0.10; *, p < 0.05; **, p < 0.01; ***, p < 0.001; ^ or v are used in place of * to specify a significant increase or decrease, respectively. Statistical comparisons were with vehicle-treated WT ± formate or NTC ± formate samples, as appropriate. ns = not significant.

