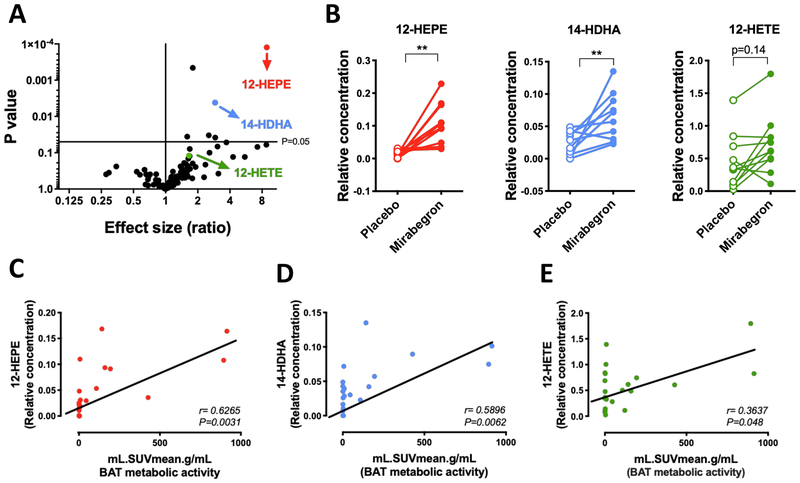
Figure 2: Mirabegron treatment increases the secretion of 12-LOX metabolites in human subjects.
A) Volcano plot of the lipids profiled in plasma showing fold change between human subjects treated with a single oral dose of the β3-adrenergic agonist mirabegron (200mg) and subjects treated with placebo compared to the p-value of this comparison, (n = 10-11). p values determined by multiple t-tests.
B) Circulating levels of the 12-LOX derived lipids from human subjects treated with placebo or mirabegron (n = 10-11). **p<0.01, ***p<0.001. Data are represented as paired individual values.
C-E) Spearman correlation between circulating 12-LOX metabolites levels and BAT glucose uptake measured by PET-CT, and expressed as standardized uptake values (SUV), obtained from human subjects treated with placebo or mirabegron. See also Figure S2.
All the lipid quantification data were detected using non-targeted lipidomics, thus relative values are shown.

