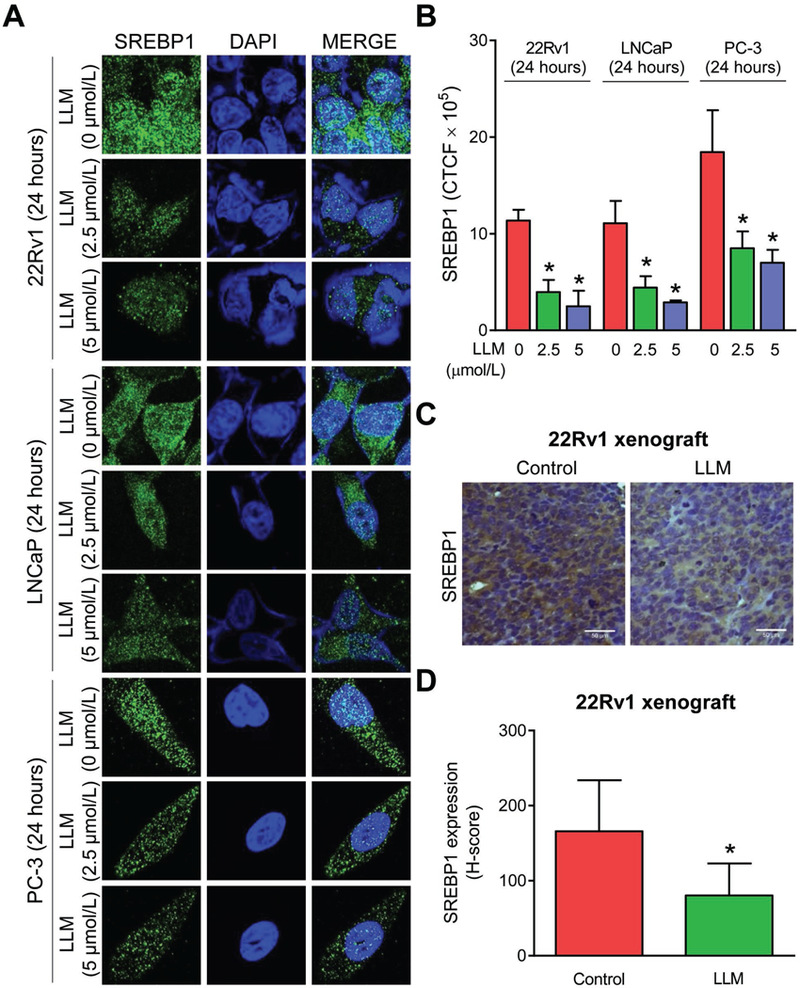
Figure 5.

LLM treatment downregulated SREBP1 protein expression in prostate cancer cells in vitro and in 22Rv1 xenografts in vivo. A, Confocal microscopy images depicting expression of SREBP1 protein in 22Rv1, LNCaP, and PC-3 cells after 24-hour treatment with ethanol (control) or 2.5 or 5 µmol/L of LLM. B, Quantitation of corrected total cell fluorescence (CTCF) for SREBP1 protein expression using ImageJ software. Results shown are mean ± SD (n=3). *Significantly different (P<0.05) compared with corresponding ethanol-treated control by one-way ANOVA followed by Dunnett’s test. Comparable results were observed in replicate experiments. C, Immunohistochemistry for SREBP1 protein in a representative 22Rv1 xenograft section of control mouse and that of a LLM-treated mouse (×400 magnification, scale bar= 50 μm). D, Quantitation of SREBP1 expression (H-score). The results shown are mean ± SD (n=6 for control and n=5 for LLM treatment group). *Significantly different compared with control by Student’s t-test.
