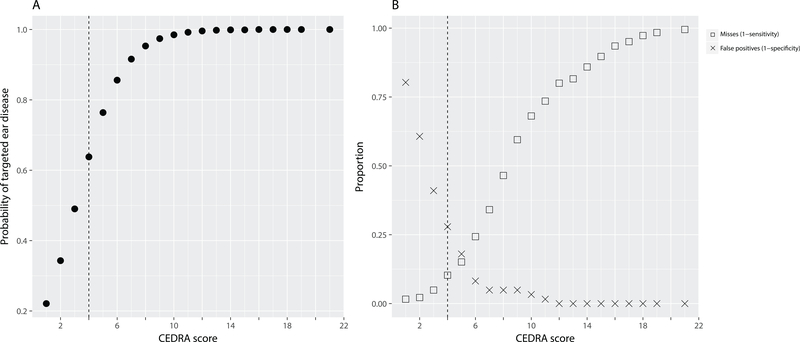
Figure 1.
Results from the initial test of CEDRA (n=307), showing A: The probability of a diagnosis of targeted ear disease(s) by a certified neurotologist plotted against the CEDRA score. B: The relationship of the CEDRA scores to the missed diseases (squares) and unnecessary referrals (crosses). BOTH: The vertical dashed line shows the recommended consumer cut-off score of 4 or higher.

