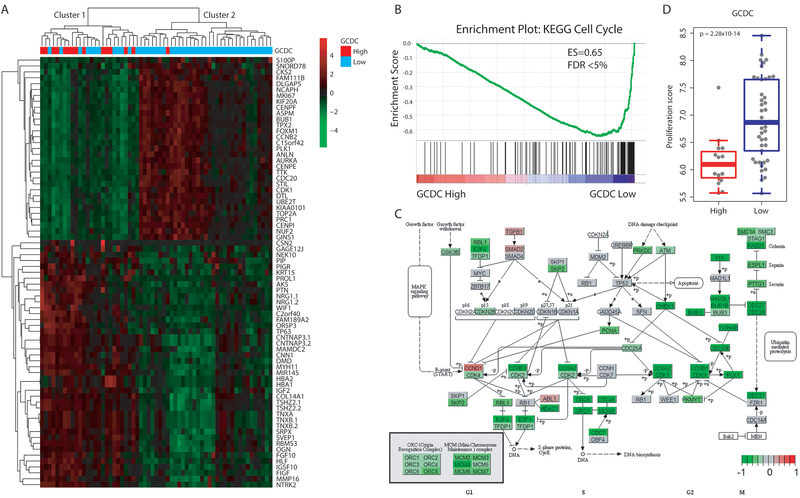
Figure 3. Transcriptome profile of GCDC-high tumors indicates that GCDC may target cell cycle pathways and inhibit tumor cell proliferation.
A. Hierarchical clustering based on differentially expressed genes between tumors with high (n=15) or low (n=46) abundance of GCDC. Heatmap represents the most differentially expressed transcripts associated with GCDC abundance with ∣fold change∣ > 2 and FDR < 0.05 (n = 73). Low GCDC: GCDC is at the detection limit in these tumors. Red indicates up-regulated genes and green indicates down-regulated genes. Cluster 1 is enriched for GCDC-high tumors. B. Gene set enrichment analysis identifies the KEGG Cell Cycle pathway as the top down-regulated pathway in GCDC-high breast tumors (Enrichment score = −0.65 and FDR < 0.05). C. Genes were mapped to the KEGG Cell Cycle pathway and labeled as red and green when up- or down-regulated in GCDC-high tumors, respectively, indicating common down-regulation of G1, S, and G2/M phase genes. Dark green indicates down-regulation of many G2/M phase genes. D. Tumor proliferation score is higher in GCDC-low than GCDC-high tumors. A Wilcoxon rank test was applied for significance testing to compare proliferation scores between GCDC-high (n = 15) and low tumors (n = 46).

