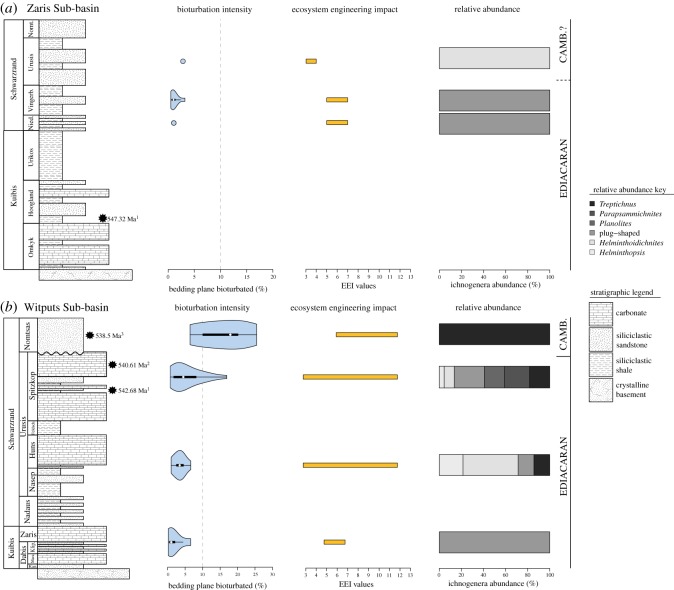
Figure 3.
Resulting violin plots of point-counted bedding-plane bioturbation percentages, range of EEI values and relative abundance of each trace fossil for the Nama Group. (a) Results for the Zaris Sub-basin (from bottom to top) Niederhagen Member, Vingerbreek Member and Urusis Formation. (b) Results for the Witputs Sub-basin (from bottom to top) Kliphoek Member, Nasep Member, Spitzkop Member and Nomtsas Formation. Darker grey colours for ichnogenera indicate relatively high EEI values, while lighter grey colours indicate relatively low EEI values. Vertical dashed line on bioturbation percentages plots indicates boundary between BPBI = 2 and BPBI = 3.

