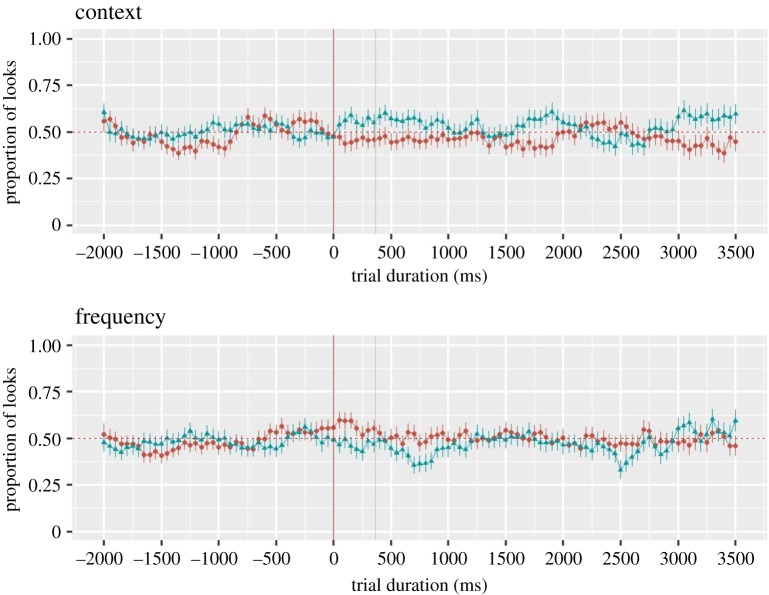
Figure 5.
Time course of looking behaviour (in 50 ms bins) in the context and frequency conditions. Matching trials are red circles and related trials are blue triangles. Dots represent the mean and the bars represent the standard error of the mean (averaged over item pairs). The red vertical line indicates word onset, the grey vertical line indicates 367 ms from word onset.

