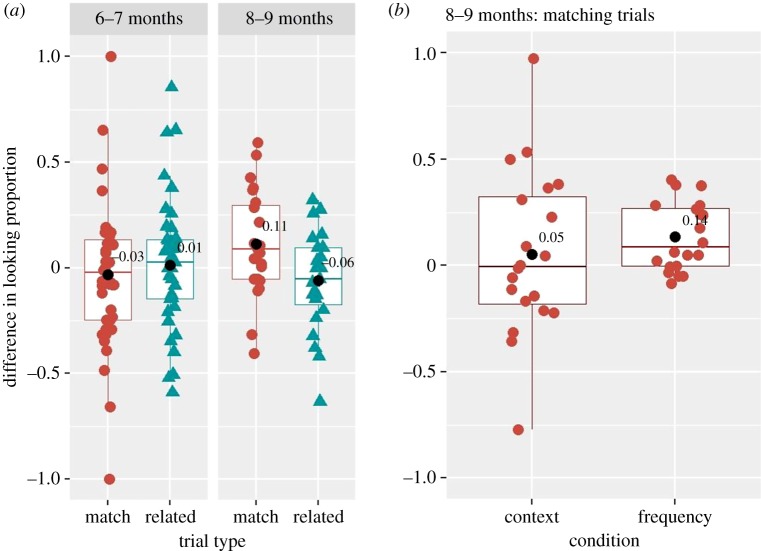
Figure 8.
Boxplot showing the distribution of the difference in looking proportion for six- to seven- and eight- to nine-month-old infants on matching and related trials (a) and for eight- to nine-month-old infants on matching trials only in context and frequency conditions (b). Data were averaged across item pairs. Black circles indicate average values over all subjects in a given trial type and condition.

