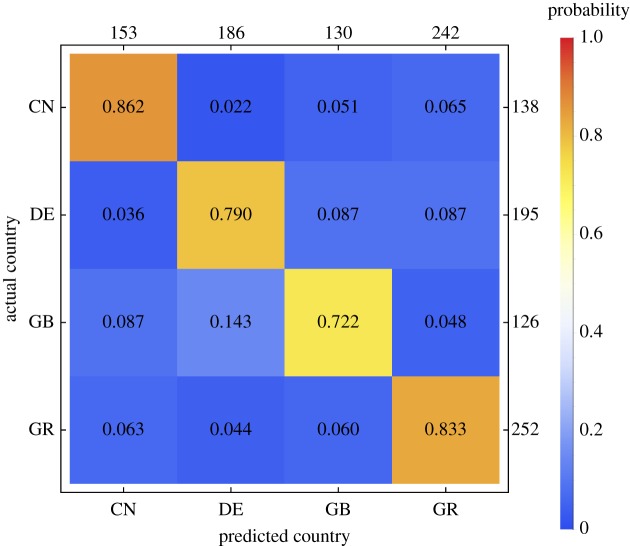
Figure 7.
Confusion matrix for the prediction of the country of origin based on the 12 × 20 colour–emotion association ratings provided by each participant. Rows represent the actual and columns the predicted country of origin, respectively (CN: China, DE: Germany, GB: United Kingdom, GR: Greece). The number in each cell represents the probability that a participant originating from the country specified on the vertical axis (row) was classified as originating from the country specified on the horizontal axis (column). Thus, proportions on the main diagonal represent the true positive rate, or recall. The numbers on the right-hand side of the frame represent the absolute frequency of participants actually originating from a given country. The numbers on the upper side of the frame represent the absolute frequency of participants predicted to originate from a given country.

