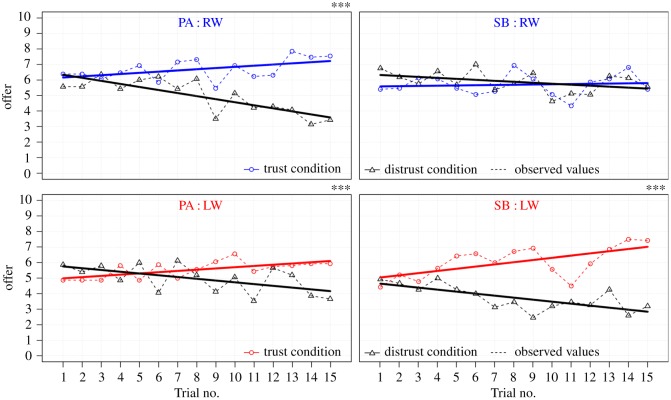
Figure 3.
Chronological visualization of TG dynamics. The average amount of investment in euros (y-axis) is plotted against the sequence of trials (x-axis). The pairs of curves correspond to the trust/distrust conditions of the game, per each group (RW/LW) and trustee (SB/PA). The resulting trial-by-trial overview displays observed (dashed lines) and modelled/predicted economic behaviour (solid lines). ***p < 0.001.

