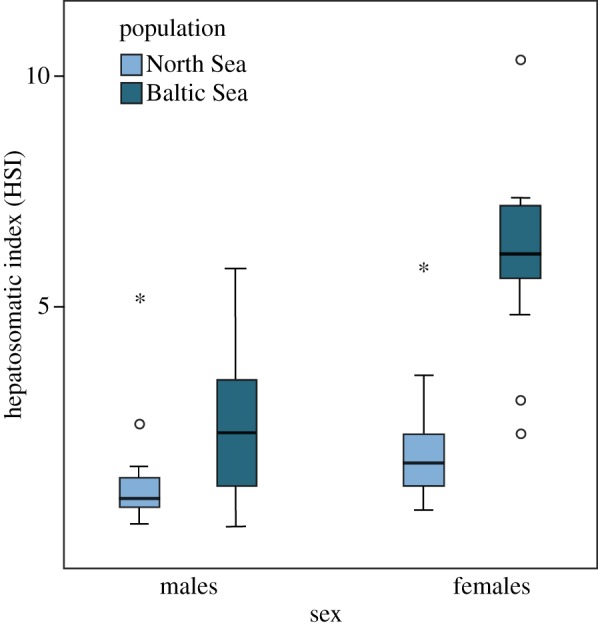
Figure 2.

Hepatosomatic index (HSI: dry liver mass × 100/dry gutted somatic body mass) of male and female sand gobies, Pomatoschistus minutus, from a North Sea and a Baltic Sea population. Untransformed values are shown here, while square-root transformed data were used in the analysis. In the graph, bands indicate median values, boxes represent 25th to 75th percentiles and whiskers represent 95th percentiles. Outliers and extreme outliers are shown as circles and asterisks respectively.
