
Figure 2.
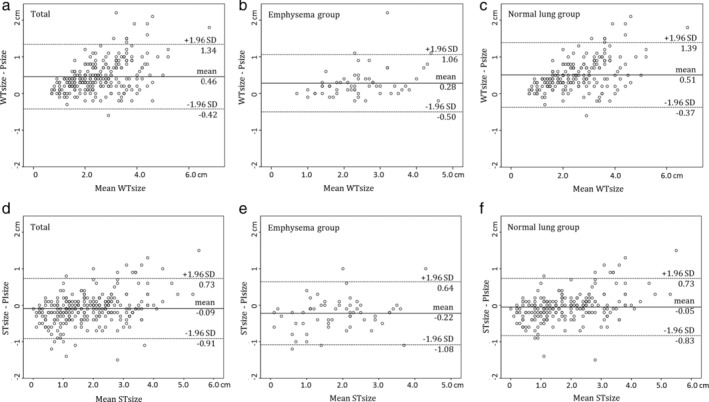
Bland‐Altman plots for radiologic whole and solid tumor measurements on TSCT recorded by two radiologists. (a,b,c) Bland‐Altman plots show agreement in whole tumor measurement between radiologic and pathologic assessment (a), in the emphysema (b) and normal lung group (c). (d,e,f) Bland‐Altman plots show agreement in invasive tumor measurement between radiologic and pathologic analysis (d), in the emphysema (e) and normal lung group (f).