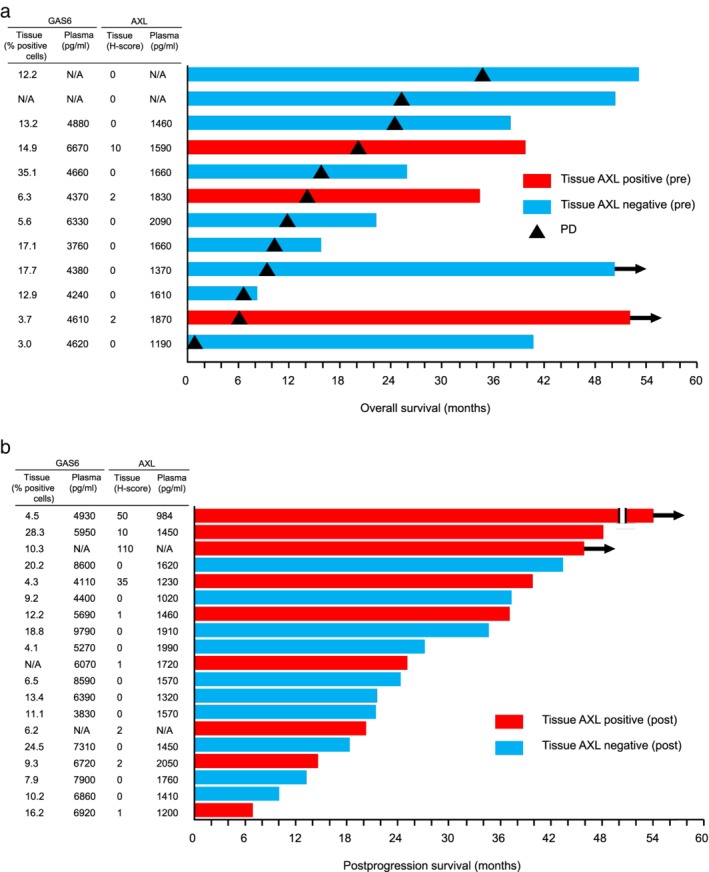
Figure 3.

Swimmers plots of survival according to AXL expression in tumor tissue. (a) Swimmer plot of overall survival for patients according to the H‐score for AXL expression in tumor tissue before EGFR‐TKI treatment (pre). Red and blue bars indicate AXL‐positive (H‐score of ≥1) and AXL‐negative tumors, respectively, and bar length denotes overall survival after initiation of EGFR‐TKI therapy. Triangles indicate disease progression (PD) during initial EGFR‐TKI therapy, and arrows show the patient was alive at last follow‐up. (b) Swimmer plot of postprogression survival for patients according to the H‐score for AXL expression in tumor tissue after the development of resistance to initial EGFR‐TKI therapy (post). Bar length indicates postprogression survival after the development of EGFR‐TKI resistance. N/A, not available.
