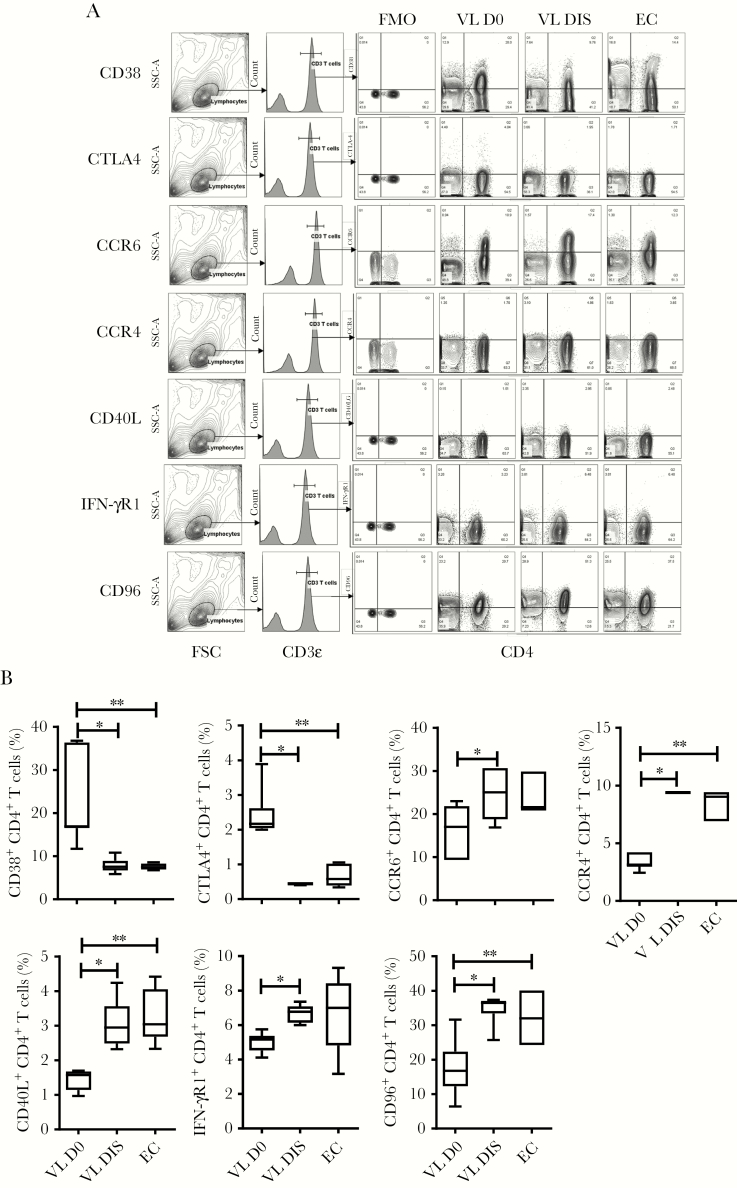
Figure 3.
Changes in immune molecule expression by CD4+ T cells. The fluorescence-activated cell sorting plots show the gating strategy used to identify CD38+, CTLA4+, CCR6+, CCR4+, CD40L+, IFN-γR1+, and CD96+ CD4+ T cells (A), and the frequency of these subsets among CD4+ T cells between visceral leishmaniasis (VL) patients during infection (D0; n = 6), VL patients after treatment (n = 6), and endemic controls (n = 6), median + minimum and maximum (B). *P < .05, **P < .01, Wilcoxon matched-pairs signed-rank test. Abbreviations: DIS, visceral leishmaniasis patients after treatment; D0, day zero; EC, endemic control; FMO, fluorescence minus one; FSC, forward scatter; IFN, interferon; SSC-A, side scatter-A; VL, visceral leishmaniasis.

