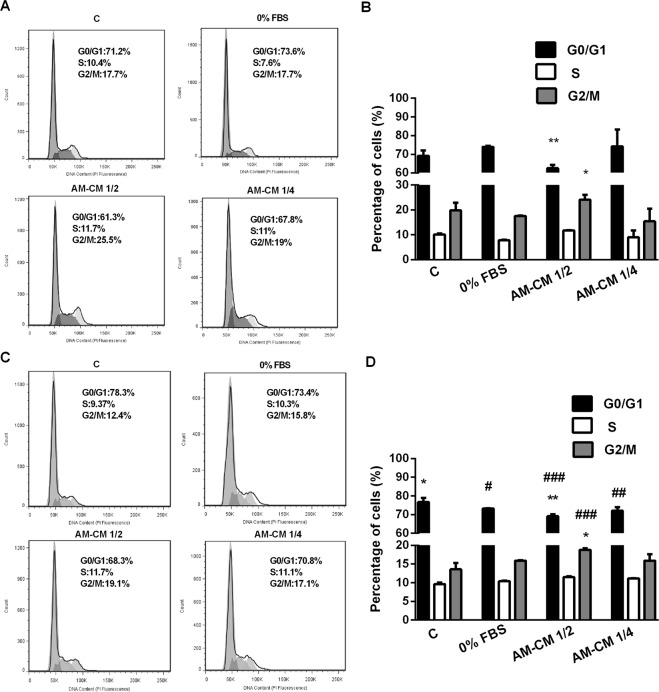
Figure 2.
HepG2 cells cycle progression is inhibited by AM-CM treatment. HepG2 cells (5 × 10⁵) were grown in 6-wells plate in DMEM-F12 10% FBS during 24 h. Then, medium was replaced by treatment with DMEM 10% FBS (C), DMEM 0% FBS (0% FBS), AM-CM 1/2 or AM-CM 1/4. After 24 h and 72 h cells were processed and analyzed by flow cytometry, as indicated in Materials and Methods. In (A,C) the cell population was selected on the basis of size (FSC-H) and granularity (SSC-H) and this population was plotted in PI-A vs PI-W plot in order to discriminate doublet population. Then singlet population was selected and plotted in count vs PI (propidium iodide) intensity graph. Graphs represent the distribution of HepG2 cells in different phases of cell cycle at 24 h (A) or 72 h (C) of treatment. The peak on the left in all graphs represents the G1 population and peak on the right represents the G2/M population. The valley between these two peaks represents the S phase population (B–D). The bar diagram represented the % of cells in different phases of cell cycle after 24 h (B) or 72 h (D) of treatment. Results are expressed as means ± S.D. (n = 3) and one from a representative experiment is shown. *p < 0.05, **p < 0.01 vs. 0% FBS; #p < 0.05, ##p < 0.01, ###p < 0.01 vs. 10% FBS

