Figure 4.
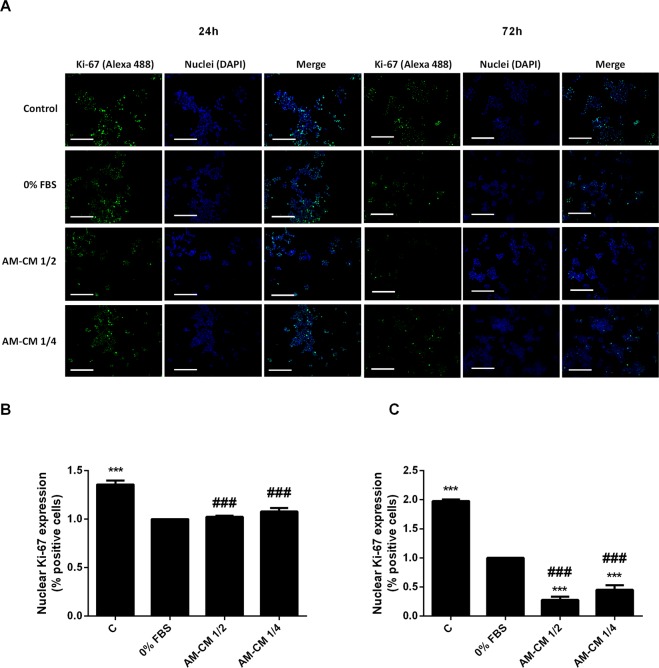
Ki-67 expression is diminished after AM-CM treatment. (A) HepG2 cells were seeded in 24-wells plate and treated with DMEM-F12 10% FBS (C), DMEM-F12 0% FBS (0% FBS), AM-CM 50% diluted (AM-CM 1/2), AM-CM 25% diluted (AM-CM 1/4), at indicated times. Cells were fixed and Ki-67 expression (green) was detected using Alexa-488 conjugated secondary antibody, at indicated times. Representative micrographs from HepG2 taken at 10X are shown. The nuclei were stained with DAPI (blue). (B,C) Graph shows the number of HepG2 nucleus positive for Ki-67 at 24 h (B) and 72 h (C) of treatment. Scale Bar: 100 μm. Results are expressed as means ± S.D. (n = 5) and one from a representative experiment is shown. ***p < 0.001 vs. 0% FBS; ###p < 0.001 vs. 10% FBS.

