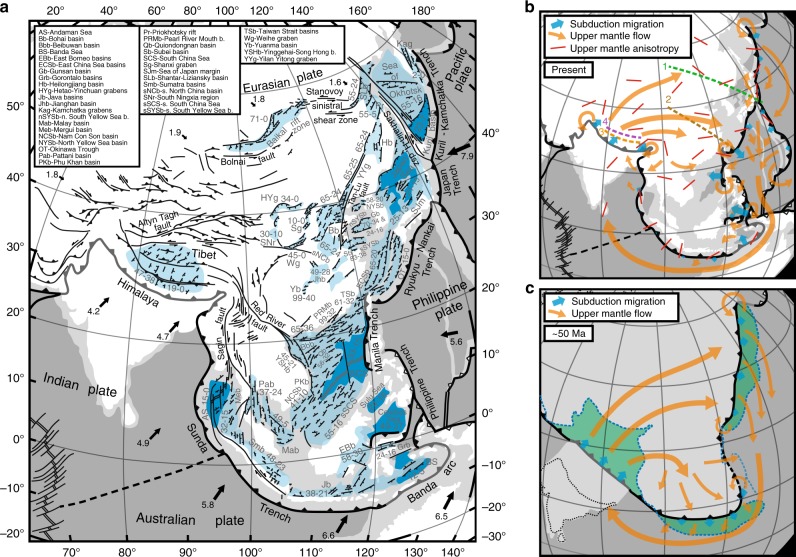
Fig. 1.
Structural-tectonic maps showing widespread Cenozoic continental deformation in Central, East and Southeast Asia. a Structural-tectonic map showing structures and ages of extensional basins (see Supplementary Note 1). Arrows indicate present-day plate velocities (in cm year−1) in the Indo-Atlantic hotspot reference frame81. Numbers next to extensional structures/basins indicate timing of extensional activity (in Ma). Light blue areas represent extended continental crust, dark blue areas represent backarc/marginal basin oceanic crust. b, c Present-day tectonic setting and simplified tectonic reconstruction at ~50 Ma of Central, East and Southeast Asian convergent plate boundaries showing oceanic/continental subduction zone migration (blue arrows) and proposed large-scale upper mantle flow patterns (orange arrows) that accommodate lateral slab migration (Indian continental slab advance and predominant retreat for oceanic slabs). Red bars in b indicate regional pattern of upper mantle anisotropy based on seismic shear wave splitting measurements derived from various sources45,46,49,82. Dashed lines with numbers 1–4 in b indicate sections along which Cenozoic finite extension has been estimated (see “Methods”). Blue dashed lines in c indicate present-day position of main Asian convergent boundaries to illustrate finite plate boundary migration since ~50 Ma. Green areas in c illustrate surface areas of upper mantle volumes displaced since ~50 Ma by lateral slab migration. The simplified reconstruction in c is based on earlier reconstructions for the Himalaya–Tibet region and Southeast Asia74,75, for the East China region17, for the Japan region76,77 and for the Kuril-Kamchatka-Sea of Okhotsk region26

