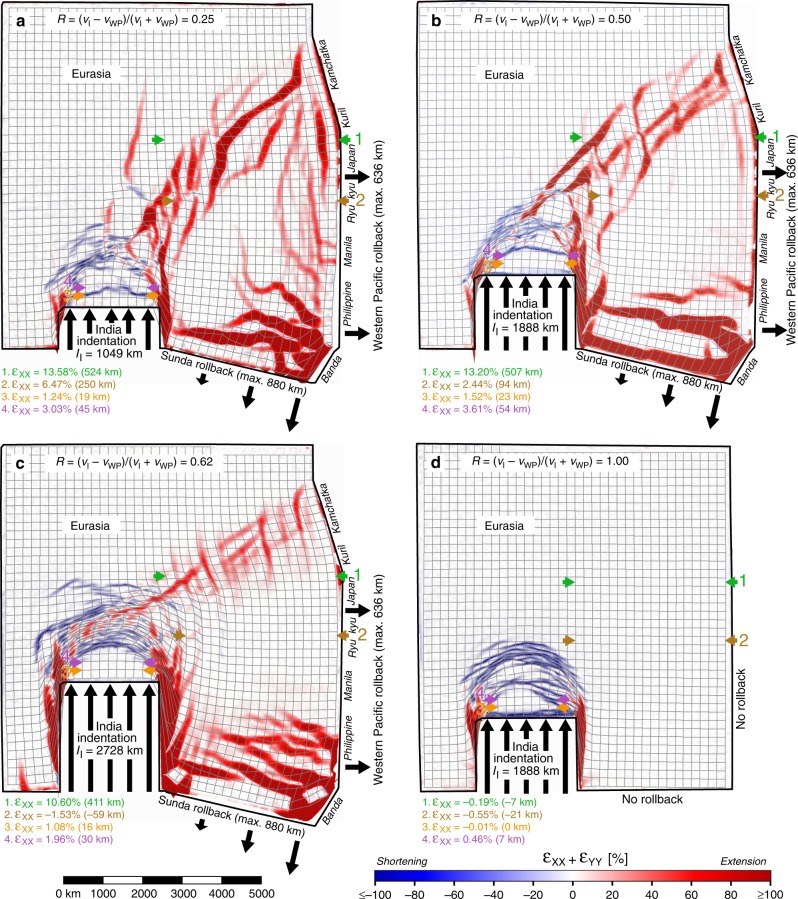
Fig. 3.
Top views of four experiments with different velocity ratios showing finite horizontal normal strain (εXX + εYY) and deformed model grid. The experiments simulate Asian continental deformation and the velocity ratio is expressed as R = (vI − vWP)/(vI + vWP), where vI = Indian continental subduction hinge and slab advance (roll-forward) velocity and vWP = Pacific subduction hinge and slab retreat (rollback) velocity. The results are shown for the end of each experimental run. a Experiment IMIN-R with R = 0.25 (minimum indentation). b Experiment IINT-R with R = 0.50 (intermediate indentation). c Experiment IMAX-R with R = 0.62 (maximum indentation). d Experiment IINT-NR with R = 1.00 (intermediate indentation and no rollback). Note that the colour scheme indicates εXX + εYY. The locations of four east–west sections (1–4) along which east–west finite strain (εXX) and finite extension are calculated are indicated with green, brown, orange and purple arrows (extension is positive, shortening is negative). These sections are the model equivalents of sections 1–4 shown in Fig. 1b. Experimental results showing the horizontal finite strain ellipse field, digital photographs, horizontal finite displacement field and surface topography are presented in Supplementary Figs. 1–4. Four evolutionary stages of experiments IINT-R and IMIN-R are shown in Supplementary Figs. 5 and 6, respectively

