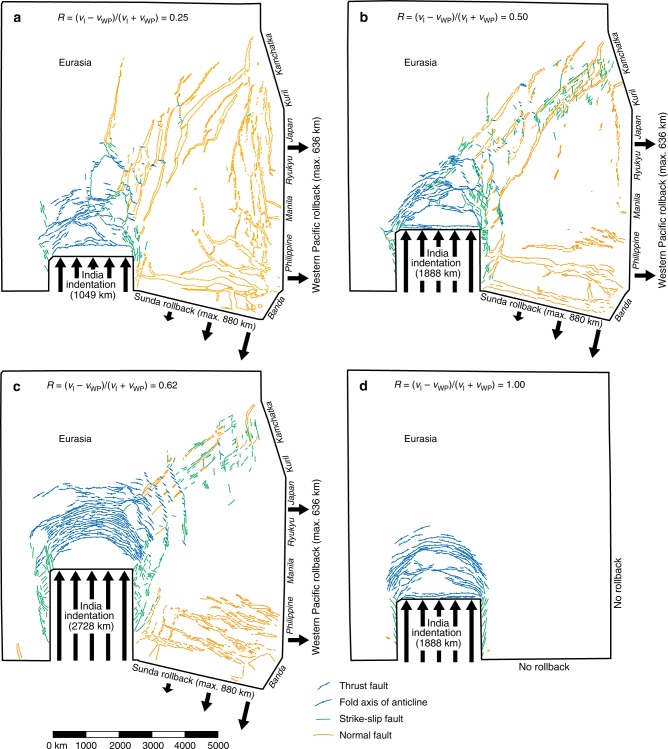
Fig. 4.
Top views of four experiments simulating Asian deformation with different velocity ratios (R) showing the surface structures. The results are shown for the end of each experimental run. a Experiment IMIN-R with R = 0.25 (minimum indentation). b Experiment IINT-R with R = 0.50 (intermediate indentation). c Experiment IMAX-R with R = 0.62 (maximum indentation). d Experiment IINT-NR with R = 1.00 (intermediate indentation and no rollback). Note that thrust faults and anticlinal fold axes are in blue, strike-slip faults are in green and normal faults are in orange

