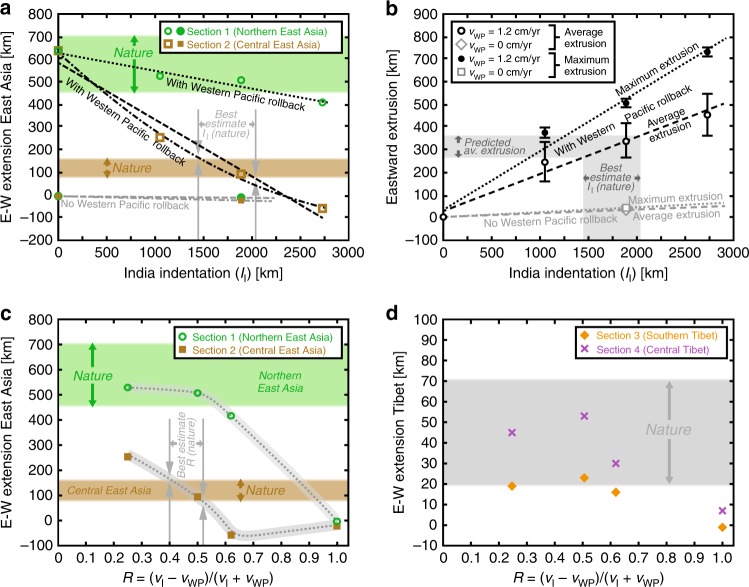
Fig. 6.
Continental extension and extrusion as a function of Indian indentation (II) and indenter-rollback ratio R. a East–west extension as a function of II along two sections (1 and 2) for experiments with Western Pacific slab rollback (open symbols) and without Western Pacific slab rollback (filled symbols) and for the representative sections in nature (see “Methods”). b Average and maximum eastward continental extrusion as a function of II for experiments with Western Pacific slab rollback (circles) and without Western Pacific slab rollback (diamond and square). Predicted indentation and predicted average eastward extrusion in nature are shown in a and b, respectively. Black dashed and black dotted lines in a and b are least-squares linear best-fit lines (coefficients of determination of 0.964 (a, dashed), 0.951 (a, dotted), 0.970 (b, dashed) and 0.980 (b, dotted)). Correlations are statistically significant at 95% (a, dotted, p value = 0.028), 98% (a, dashed, p value = 0.019), 99% (b, dotted, p value = 0.008) and 98% (b, dashed, p value = 0.014) confidence level using Fisher’s z. Black dash-dot line in a is quadratic best-fit line (coefficient of determination 0.996). c, d Finite east–west extension in East Asia and Tibet as a function of R along experimental sections 1 and 2 and sections 3 and 4, respectively, and the ranges for these sections in nature (see “Methods”). For section locations in nature and experiments, see Figs. 1b and 3, respectively. Note that errors in measuring experimental values are smaller than the sizes of the individual markers. Also note that the black bars in b are not error bars but represent the minimum and maximum values measured for the average eastward extrusion and the maximum eastward extrusion as determined from the grid lines in Fig. 3 originally located north of the easternmost 600–850 km of the Indian indenter

