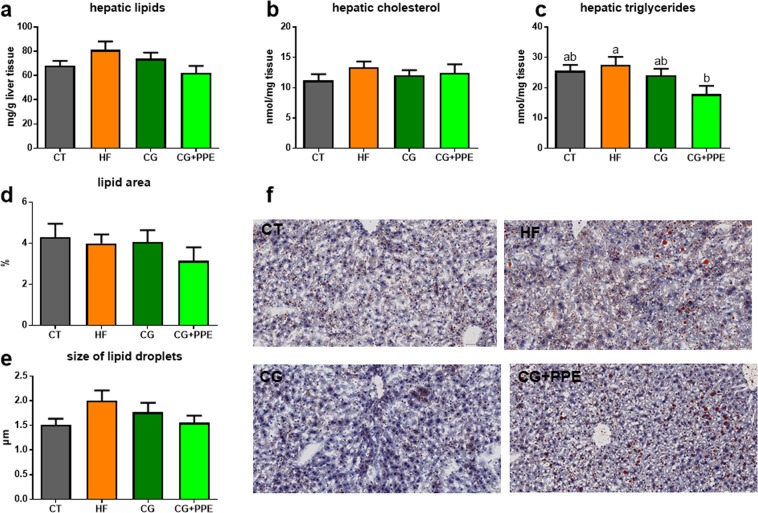
Figure 2.
Lipid accumulation in the liver tissue. Hepatic content of lipids (a), cholesterol (b) and triglycerides (c) of ApoE−/− mice fed a low fat diet (CT), a high fat (HF) diet or a HF diet supplemented with 5% chitin-glucan (CG) or a combination of 5% CG and 0.5% pomegranate peel extracts (CG + PPE) for 8 weeks. Lipid fraction area (d) and mean size of lipid droplets (e) were automatically analysed by ImageJ from Oil red O staining of frozen section of the main lobe of liver, bar = 100 µm (f). Data with different superscript letters are significantly different at p < 0.05 (ANOVA).

