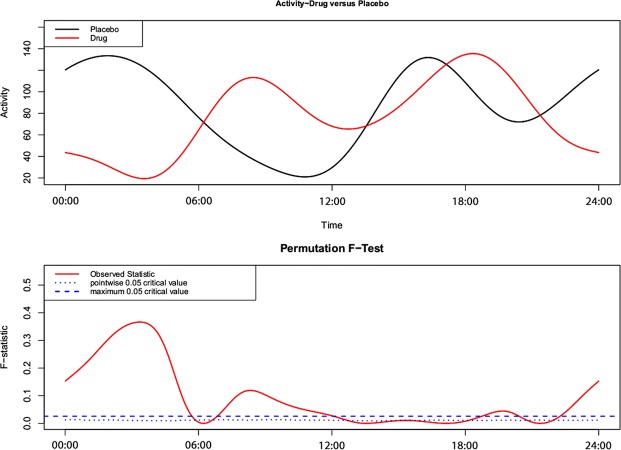
Figure 1.
A functional linear modeling comparison between the 24-hour sleep-wake pattern of placebo and drug trials. The bottom panel illustrates the point-wise critical value (dotted line). This is the proportion of all permutation F values at each time point at the significance level of 0.05. When the observed F-statistic (solid line) is above the dotted line, it is concluded the two groups have significantly different mean circadian activity patterns at those time points.

