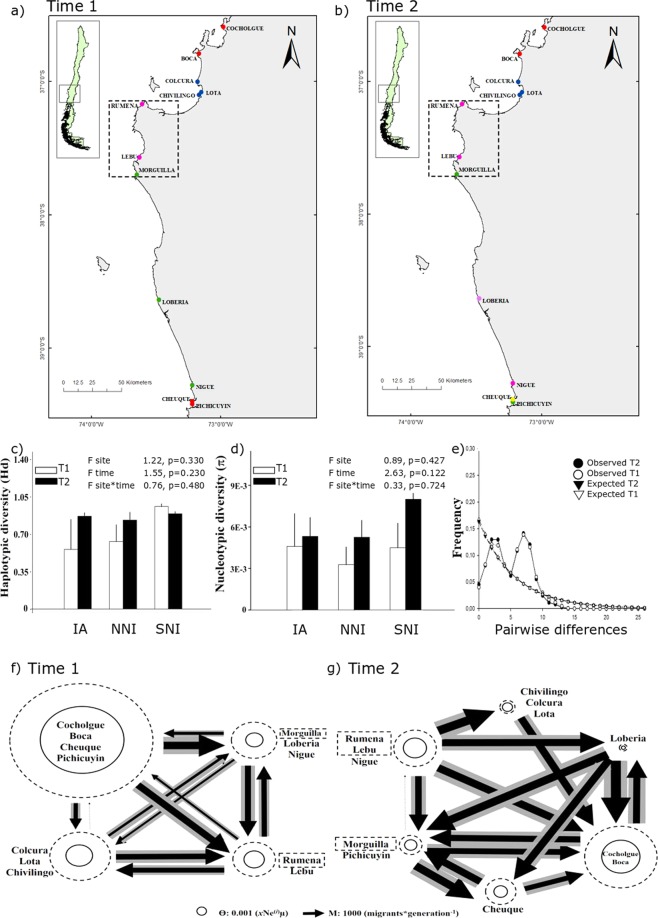
Figure 4.
Genetic clusters identified with GENELAND (each color represents a genetic cluster) at Time 1 (T1; a) and Time 2 (T2; b), mean haplotype diversity (c) and nucleotide diversity + SD (d) including genetic differences and results of AMOVA analyses among sites, times (T1 and T2), and sites-times, mismatch distribution (e), and gene flow estimated with MIGRATE-n for E. hirsuticauda at T1 (f) and T2 (g). Arrows’ width represents the amount of immigrant numbers, circles’ size represents the value of Ne. NNI: northern non-impacted area, IA: impacted area and SNI: southern non-impacted area.

