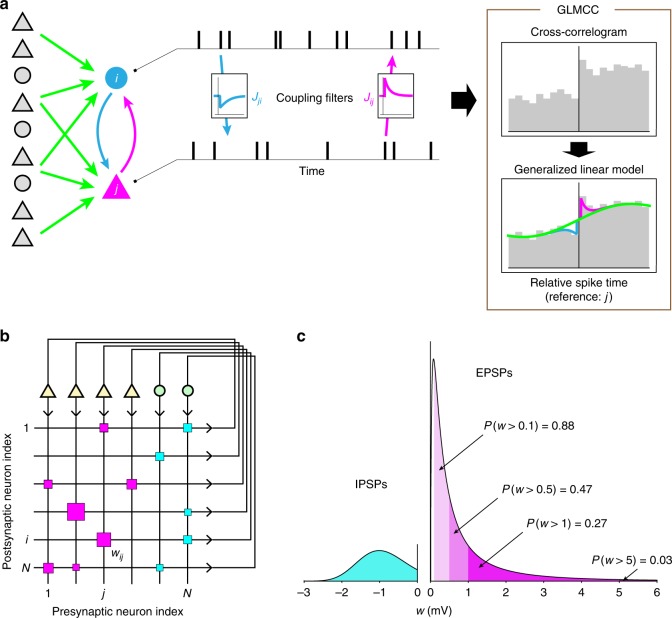
Fig. 1.
Estimating neuronal connections. a Connectivity between neurons is estimated by fitting a generalized linear model (GLM) to the cross-correlation (CC). represents a coupling from the -th neuron to the -th neuron. Excitatory and inhibitory neurons are depicted as triangles and circles, and their synaptic connections are colored magenta and cyan, respectively. Surrounding neurons may induce large-scale fluctuations in the CC (light green line). b Neuronal connectivity is visualized by the Hinton diagram, in which excitatory and inhibitory connections are represented, respectively by magenta and cyan squares of the sizes (area) proportional to the postsynaptic potential (PSP) . c Distributions of excitatory postsynaptic potentials (EPSPs) and inhibitory postsynaptic potentials (IPSPs) of a simulated network

