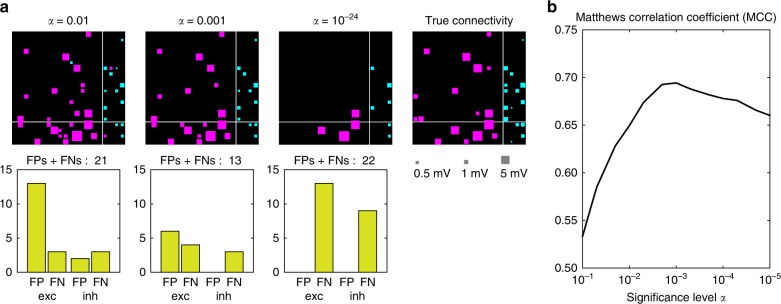
Fig. 2.
Selecting the significance level. a The connection matrices are estimated with different levels of conservatism against making false positives (FPs), which are represented by the significance level . In each connection matrix, the -axis indicates reference (index) neurons. The connection matrix is divided into four quadrants representing inhibitory–excitatory, excitatory–excitatory, excitatory–inhibitory, and inhibitory–inhibitory zones. The numbers of FP and false negative (FN) connections for the excitatory and inhibitory categories are depicted below the matrices. In the true connectivity, weak excitatory connections whose EPSPs are smaller than 1 mV are not considered. b The Matthews correlation coefficient (MCC) is plotted against the significance level . The MCC takes a maximum at an intermediate level of cautiousness, given by . Source data are provided as a Source Data file

