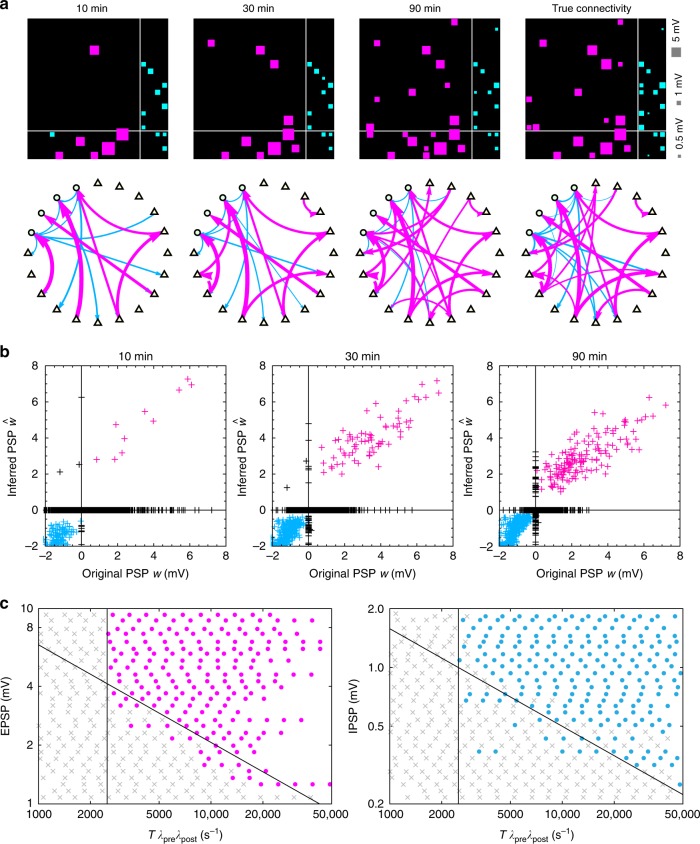
Fig. 3.
Neuronal circuits reconstructed from different observation time windows. a Neuronal connections estimated from the observation time windows of 600, 1800, and 5400 s (10, 30, and 90 min) are plotted in reference to true connectivity. In each connection matrix, the -axis indicates reference neurons. In the network graphs shown in the second panel, excitatory and inhibitory neurons are depicted as triangles and circles, respectively. b Estimated postsynaptic potentials (PSPs) () plotted against true parameters () were computed for 100 neurons randomly selected from the simulation. Points in the first and third quadrants represent qualitatively correct inferences for excitatory and inhibitory connections (magenta and cyan, respectively). Points on the nonzero -axis represent the false positive connections for unconnected pairs. Points on the nonzero -axis represent the false negatives. c Detection status for connections of given PSPs with respect to the observation window (). Connections estimated as excitatory and inhibitory are colored magenta and cyan, respectively, while undetermined ones are colored gray. Diagonal and vertical lines represent the theoretical formulas (3) and (4), respectively. Source data are provided as a Source Data file

