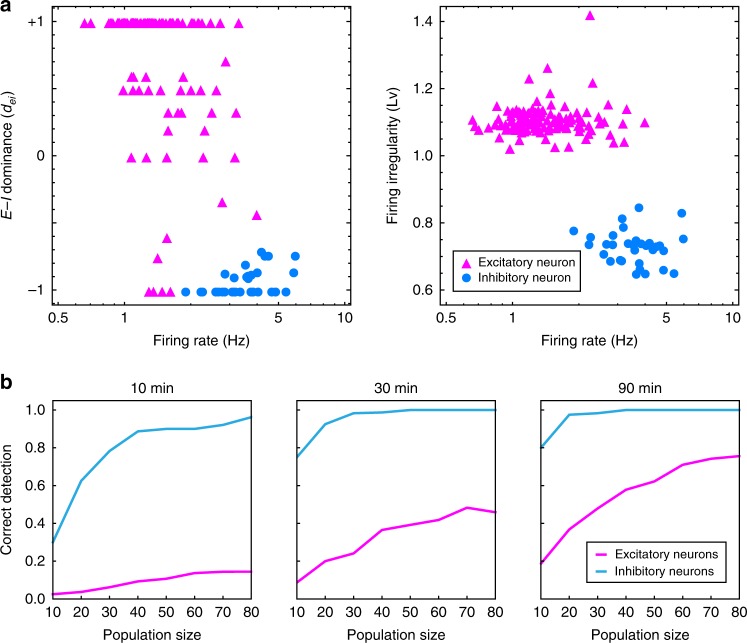
Fig. 4.
Excitatory–inhibitory (E–I) dominance index. a E–I dominance index and the firing irregularity (), plotted against the firing rate for 160 HH-type neurons (2 networks of 80 neurons). Excitatory and inhibitory neurons are plotted as triangles and disks, colored magenta and cyan, respectively. b The rates at which excitatory and inhibitory characteristics are identified correctly according to and , respectively for excitatory and inhibitory neurons. Source data are provided as a Source Data file

