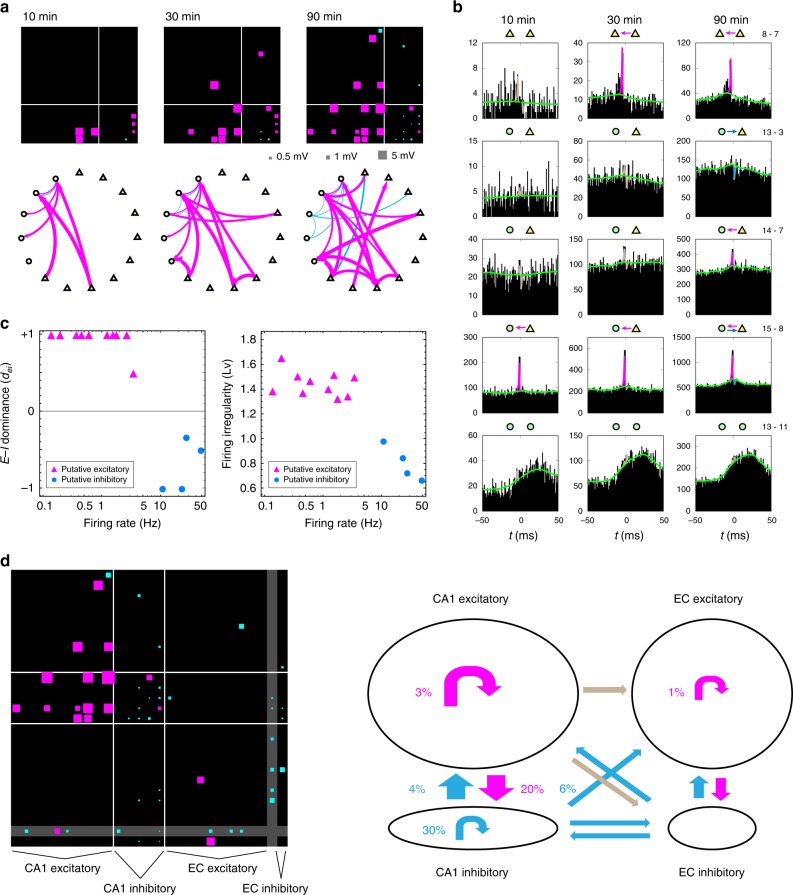
Fig. 5.
Neuronal circuits reconstructed from real spike trains in vivo. a Neuronal connections estimated from spike trains recorded from the hippocampal CA1 area of a rat. Estimations were made with observation time windows of 600, 1800, and 5400 s (10, 30, and 90 min) for neurons whose firing rate is [Hz]. In each connection matrix, the -axis indicates reference neurons. The connection matrix is partitioned into groups of putative excitatory and inhibitory neurons defined manually according to other physiological cues such as waveforms. b Cross-correlations of several pairs of neurons computed at different time windows. The slow part of the GLM adapted to the data is depicted as a light green line. The coupling filter is separately depicted in magenta, cyan, or gray, for the excitatory, inhibitory, or undetermined, respectively. Corroborated connections are indicated by arrows. c E–I dominance index () and firing irregularity () are plotted against the firing rates for putative excitatory and inhibitory neurons. Neurons with connection with firing rate and [Hz] are plotted in the E–I dominance index. d Estimated connections among neurons in CA1 and Entorhinal Cortex (EC). The connection matrix is partitioned into putative excitatory and inhibitory neurons in CA1 and EC. One EC unit, whose excitatory or inhibitory characteristic was not determined by the manual analysis, is put in the gap (gray) between excitatory and inhibitory groups. In the network graph shown in the second panel, excitatory- and inhibitory-dominated connections are depicted in magenta and cyan, while connections of mixed characteristics are depicted in gray. Source data are provided as a Source Data file

