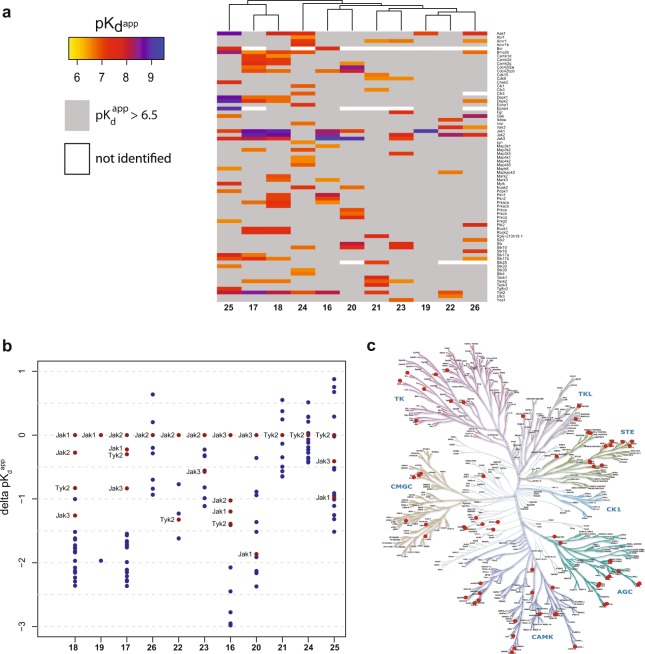
Figure 6.
Kinome-wide selectivity of JAK kinase inhibitors determined by kinobeads experiments using PBMC lysate. (a) Heatmap displaying all competed kinases from kinobeads experiments. Experiments were done in duplicate using two different concentration ranges; displayed value is mean of calculated apparent pKds. Only kinases are displayed for which at least one inhibitor showed an apparent pKd above 6.5 (b) Potency windows (delta apparent pKd) between the most potently hit JAK kinase (set as reference) to all other competed kinases for all investigated JAK kinase inhibitors. JAK kinases are marked in red, all other kinases are marked in blue. (c) Distribution of all identified JAK kinase inhibitor off-targets over the kinome tree. (see also Supplementary Table 7).

