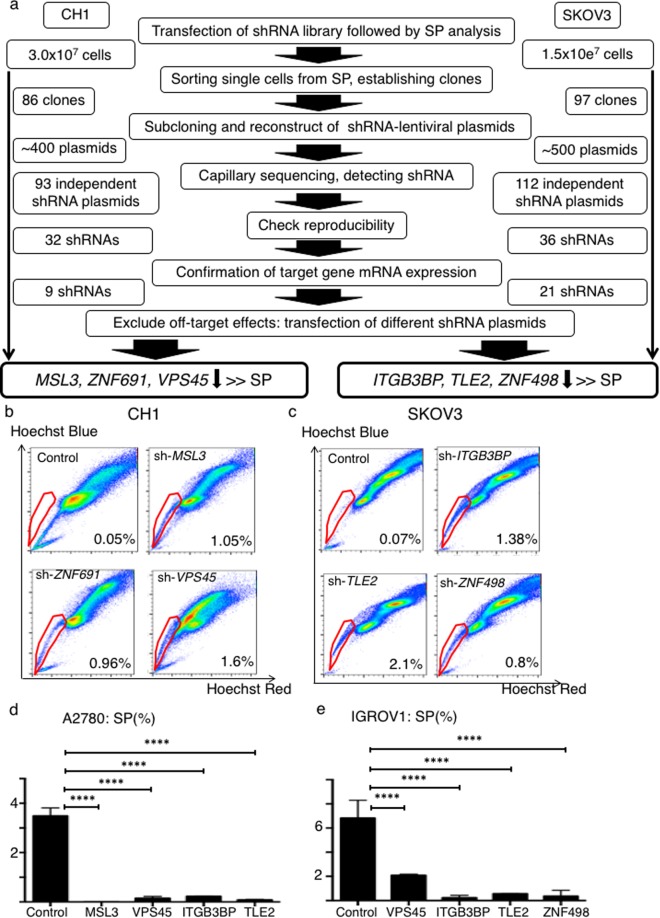
Figure 1.
Schematic of functional genomics screening. (a) Ovarian cancer cell lines, CH1 and SKOV3 were used. Following transfection of the shRNA library, we performed SP analysis and SP cells were singly plated into each well of 96-well plates. We established 86 clones in the CH1 screen and 97 clones in the SKOV3 screen. shRNAs were amplified by PCR and we reconstructed 93 different shRNA plasmids from the CH1 screen and 115 different shRNA plasmids from the SKOV3 screen. Out of 97 shRNAs in CH1 cells, 32 again markedly increased the SP fraction. Out of 115 shRNAs in SKOV3 cells, 36 again markedly increased the SP fraction. We measured mRNA expression of these 32 and 36 genes using RT-PCR, and found that 9 shRNAs in CH1 suppressed their target gene’s mRNA expression and 21 shRNAs in SKOV3 suppressed their target gene’s mRNA expression. We transfected shRNAs containing completely different anti-sequence than those initially used for each gene and performed SP analysis and RT-PCR to exclude off target effects. We identified MSL3, ZNF691 and VPS45, whose downregulation markedly increased the SP fraction of CH1 cells and ITGB3BP, TLE2 and ZNF498 whose downregulation markedly increased the SP fraction of SKOV3 cells. (b) Representative data showing the percentage of the SP fraction of control, sh-MSL3, sh-ZNF691 and sh-VPS45 CH1 cells. (c) Representative data showing the percentage of the SP fraction of control, sh-ITGB3BP, sh-TLE2 and sh-ZNF498 SKOV3 cells. (d) SP fraction percentage of A2780-control, orf-MSL3, orf-VPS45, orf-ITGB3BP and orf-TLE2. ****p < 0.0001. (e) SP fraction percentage of IGROV1-control, orf-VPS45, orf-ITGB3BP, orf-TLE2 and orf-ZNF498. ****p < 0.0001

