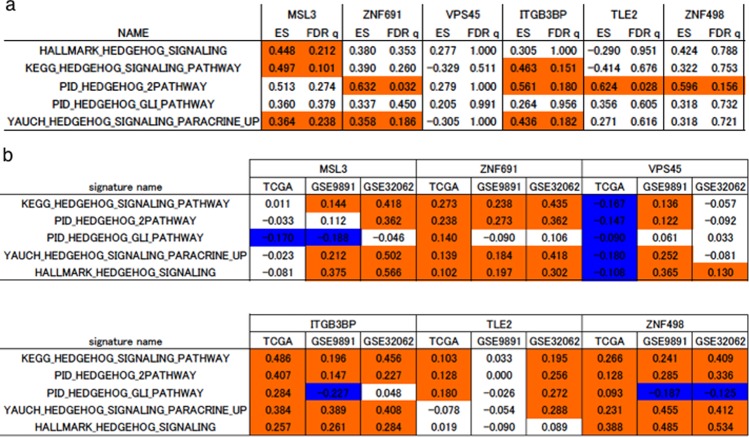
Figure 5.
Strong relationships between the hedgehog pathway and six target genes are found. GSEA and ssGSEA analysis showing the relationships between the hedgehog pathway and six target genes. GSE32062 contains 260 patients with ovarian cancer. GSE9891 contain 285 patients with ovarian cancer. (a) Results of GSEA analysis. Enrichment score (ES) and FDR q value (FDR q) are shown. Red shading indicates significant enrichment for sh-target genes at an FDR q < 0.25. (b) Results of correlation analysis between the scores of the six gene signature and the hedgehog pathway-related signature. Red shading indicates a significant positive correlation (p < 0.05) and blue shading indicates a significant negative correlation (p < 0.05).

