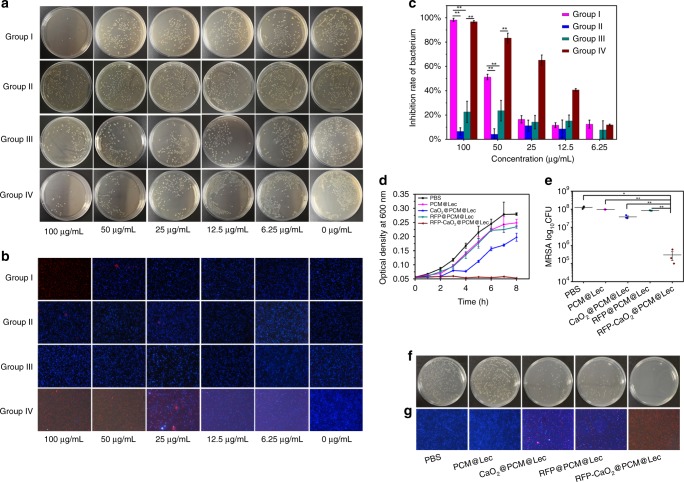
Fig. 3.
In vitro target antibacterial activity of nanoreactors. a Coated flat panel and b live/dead staining of MRSA and B. subtilis incubated with different concentrations of RFP-CaO2@PCM@Lec nanoreactors (100, 50, 25, 12.5, 6.25, 0 μg mL−1). group I RFP-CaO2@PCM@Lec+MRSA, group II PCM@Lec+MRSA, group III RFP-CaO2@PCM@Lec+B.subtilis, and group IV RFP-CaO2@PCM@Lec + B. subtilis + toxin. c Bacterial inhibition rate of MRSA and B. subtilis incubated with different concentrations of RFP-CaO2@PCM@Lec nanoreactors (100, 50, 25, 12.5, 6.25, 0 μg mL−1). d Growth curve and e bacterial inhibition rate of MRSA incubated with 100 μg mL−1 of different materials at 37 °C for 2 h. f Coated flat panel and g live/dead staining of MRSA incubated with 100 μg mL−1 of different materials at 37 °C for 2 h. PBS, PCM@Lec CaO2@PCM@Lec, RFP@PCM@Lec, and RFP-CaO2@PCM@Lec nanoreactors are shown from left to right. The mean value was calculated by the t test (mean ± SD, n = 3). *p < 0.05, **p < 0.01, ***p < 0.001, compared with the indicated group. Source data are provided as a Source Data file

