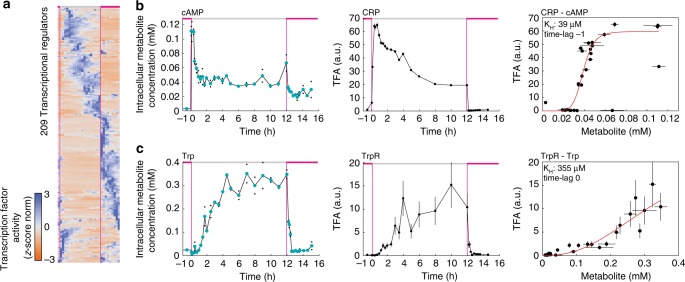
Fig. 3.
Metabolite levels and transcription factor activities recover regulatory interactions. a Z-score normalized activity of 209 transcriptional regulators. Blue indicates high activity; orange indicates low activity. Activity was estimated from the transcriptome data with network component analysis (NCA). b Dynamics of cyclic-AMP concentration (left) and CRP activity (middle) during the growth–starvation-growth switch. Correlation of cyclic-AMP and CRP activity (right). The red line is the best fit of a Hill function (KH = 39 µM). The correlation is shown with a time-lag of one data point to account for a time-delay between activity changes of CRP and changes in gene expression. c Same correlation analysis as in (b) for tryptophan (Trp) and the activity of TrpR, the repressor of the tryptophan operon. For cAMP and tryptophan, black dots show two replicates per time point, and colored dots are the mean. Error bars of transcription factor activity indicate the 95% confidence interval of n = 100 randomized estimates with NCA. Source data are provided as a Source Data file

