Fig. 5.
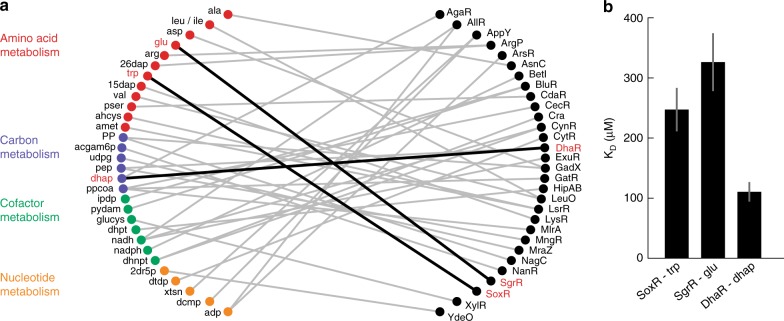
Identification and validation of new metabolite-transcription factor interactions. a Network of potentially new interactions between transcription factors and metabolites. Shown are 30 transcription factors that correlated with one or maximal two metabolites (only metabolites that fulfill the distance criterion). Metabolites are colored according to the subsystems of amino acid metabolism (red), carbon metabolism (purple), cofactor metabolism (green) or nucleotide metabolism (yellow). Connections in bold black highlight new interactions that are validated in vitro. b In vitro measured KD values of the new interactions indicated in bold in (a). Binding was measured with His-tag purified SoxR, SgrR, and DhaR using micro scale thermophoresis (MST). Error bars show the 95% confidence intervals of KD estimates, which are based on fitting n = 9 MST assays (proteins purified three times, each measured in three MST assays). MST data are shown Supplementary Fig. 9. ala alanine, leu/ile leucine/isoleucine, asp aspartate, glu glutamate, arg arginine, 26dap diaminopimelic acid, trp tryptophan, 15-dap 1,5-diaminopimelate, val valine, pser 3-phosphoserine, ahcys S-adenosylhomocysteine, amet S-adenosylmethionine, PP pentose phosphate, acgam6p N-acetyl-D-glucosamine-P, udpg UDP-glucose, pep phosphoenolpyruvate, dhap dihydroxyacetone phosphate, ppcoa propionyl-coenzyme A, ipdp isopentenyl diphosphate, pydam pyridoxamine, glucys gamma-glutamyl-cysteine, dhpt dihydropteroate, nadh nicotinamide adenine dinucleotide (reduced), nadph nicotinamide adenine dinucleotide phosphate (reduced), dhnpt dihydroneopterin, 2dr5p deoxyribose phosphate, dtdp thymidine diphosphate, xtsn xanthosine, dcmp deoxycytidine monophosphate, adp adenosine diphosphate. Source data are provided as a Source Data file

