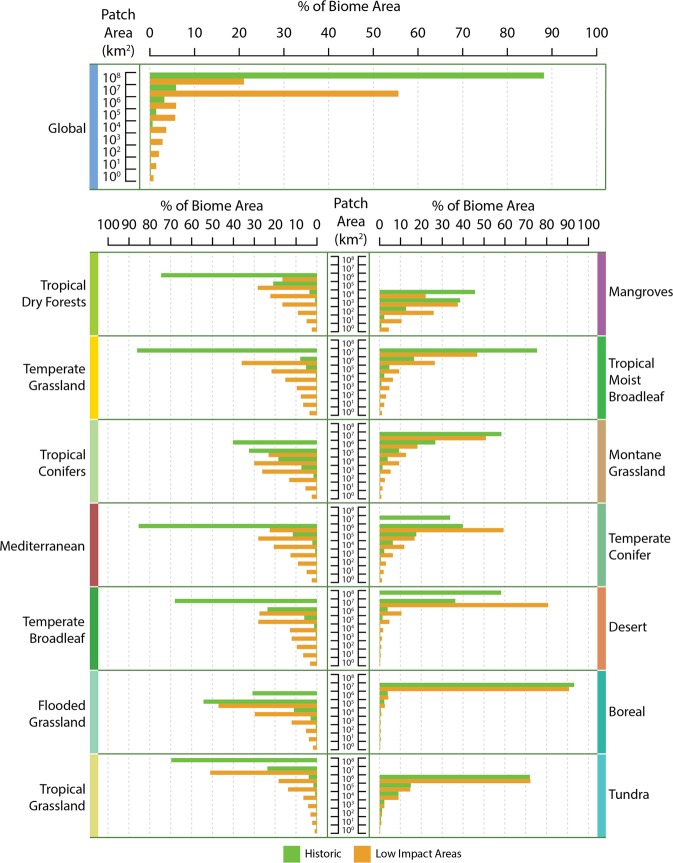
Figure 4.
Histograms of total contributed area from all patches within that patch size bin between the baseline and current Low Impact Areas. Several very large patches dominated baseline distributions of most biomes. But, with the exception of the boreal and tundra biomes, the largest patches are splintered and the amount of area found in small and medium-sized patches is substantially greater in Low Impact Areas than the baseline. Biomes are ordered top-to-bottom, then left-to-right in order of increasing percent Low Impact Area.

