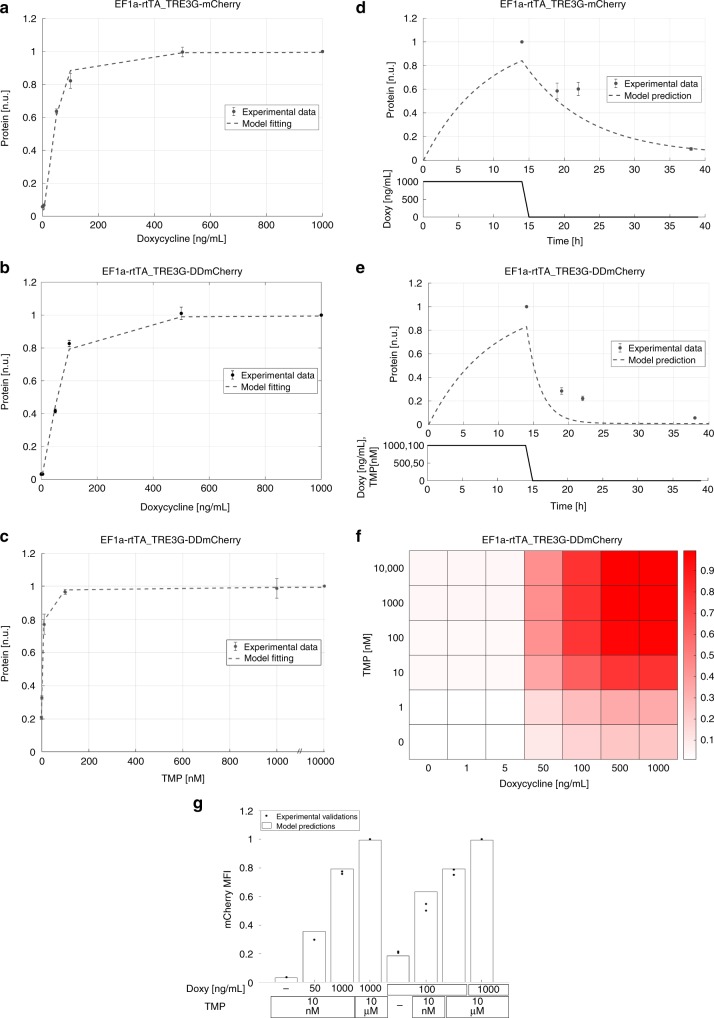
Fig. 2.
Steady-state/dynamic response and dynamic range of the dual-input system. a mCherry protein levels in EF1a-rtTA_TRE3G-mCherry mESCs following 24 h of treatment with increasing concentration of Doxy (0; 1; 5; 50; 100; 500; 1000 ng/mL). b, c DDmCherry protein levels measured in EF1a-rtTA_TRE3G-DDmCherry following 24 h of treatment with increasing concentration of Doxy (0, 1, 5, 50, 100, 500, 1000 ng/mL) and maximum TMP (10 μM) (b), or increasing concentration of TMP (0, 1, 10, 100 nM; 1, 10 μM) and maximum Doxy (1000 ng/mL) (c). d, e Dynamic response of EF1a-rtTA_TRE3G-mCherry (d) and EF1a-rtTA_TRE3G-DDmCherry (e) mESCs to Doxy (1000 ng/mL) or Doxy/TMP (1000 ng/mL and 100 nM, respectively) in a time-course experiment of 38 h, in which inducers were washed out after incubation in the first 14 h. The dots are experimental data of MFI (Supplementary Fig. 2a–d) measured by flow cytometry and normalised over the maximum activation point. Dashed lines represent model fitting of steady-state data (a–c RMSE 0.0558 in a, 0.0369 in b, 0.0534 in c) or model prediction of switch-off dynamics (d, e RMSE 0.1590 in d, 0.1773 in e). f Simulated steady-state of EF1a-rtTA_TRE3G-DDmCherry mESCs upon combined treatment with Doxy and TMP at various concentrations. DDmCherry simulated values are shown as heatmaps of scaled values across the entire dynamic range of expression levels. g Experimental validation (dots) of simulations (bars) in (f), measuring EF1a-rtTA_TRE3G-DDmCherry mESC steady-state following 24 h induction with constant concentration of Doxy (100 ng/mL) and varying TMP (0, 10 nM; 10 μM), or constant TMP (10 nM) and varying Doxy (0, 50, 1000 ng/mL). Maximum concentrations of Doxy and TMP (1000 mg/mL and 10 μM, respectively) are used as control. Data are means ± SD (n = 3, a–c); ±SEM (n = 3 (d, e); n = 2, (g)). Source data are provided as a Source Data file

