Figure 1.
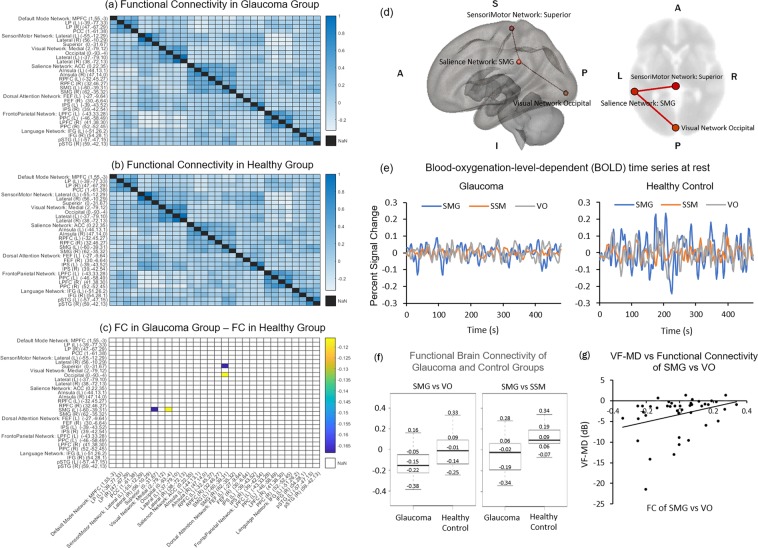
Functional brain connectivity in glaucoma (n = 32) and healthy control (n = 10) subjects. (a–c) Heat maps showing correlation coefficients (r) between temporal profiles for each pair of brain regions-of-interest (ROIs) in glaucoma subjects (a), healthy controls (b), and the difference between glaucoma subjects and healthy control (glaucoma – control) (c) during task-free functional MRI. The coordinates in brackets indicate the center of ROIs in Montreal Neurological Institute (MNI) space. Details of the seed and target brain regions can be found in Supplementary Information 2. In (c), correlation coefficients are shown only for ROI pairs with significant group differences; (d) Three-dimensional sagittal (left) and 2-dimensional axial (right) views of the brain showing the locations of the left supramarginal gyrus (SMG), the visual occipital area (VO), and the superior sensorimotor area (SSM); (e) Time series of blood-oxygenation-level-dependent (BOLD) signal percent change for SMG (blue), SSM (orange), and VO (grey) in glaucoma subjects (left) and healthy controls (right); (f) Box and whisker plots showing functional connectivity (FC) between SMG and VO areas (left) or between SMG and SSM areas (right) in terms of correlation coefficients (r) for both glaucoma and healthy control subjects. In descending order, values represent: maximum, third quartile, median, first quartile, and minimum. FC between SMG and SSM was greater than zero in healthy controls (p < 0.05) but was not different from zero for glaucoma subjects (p = 0.07). Conversely, FC between SMG and VO was less than zero in glaucoma subjects (p < 0.001) but was not different from zero in healthy controls (p = 0.48); (g) Scatter plot showing association between visual field mean deviation (VF-MD) and FC between SMG and VO areas for all subjects.

