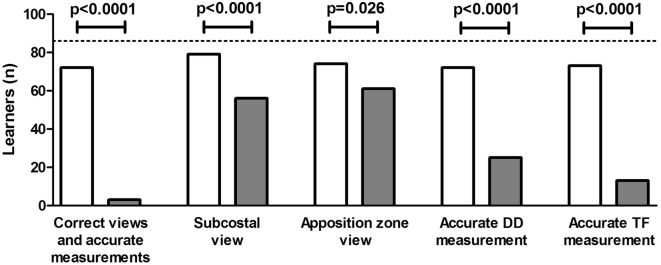
Fig. 1.
Number of learners reaching the study aims. From left to the right, the figure depicts the number of learners that: (1) correctly detected both acoustic windows and performed accurate measurements (first outcome); (2) correctly identified the subcostal view; (3) correctly identified the apposition zone; (4) accurately performed the DD measurement; and (5) accurately performed the TF measurement. White bars represent the intervention group while grey ones the control group. The dashed line represents the total number of learners randomized per group (n = 86)

