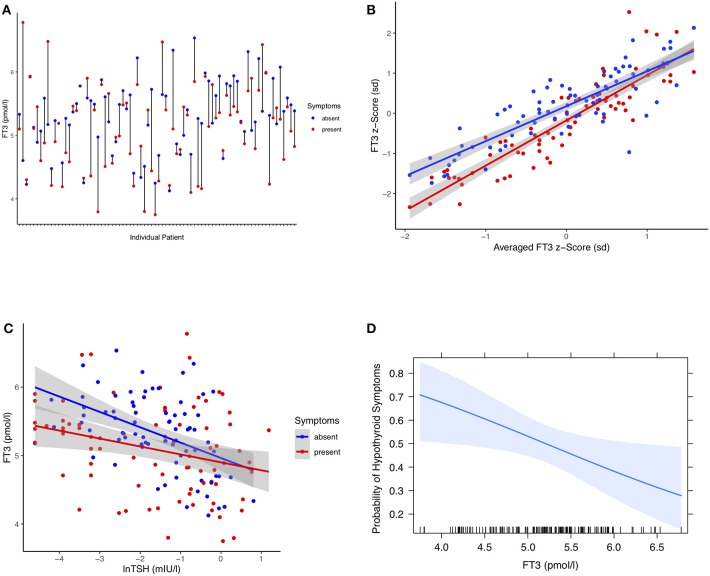
Figure 2.
(A) Difference plot of serum FT3 concentrations in 77 individual patients at either visits with hypothyroid symptoms or asymptomatic presentations. Each point refers to pooled measurements obtained from a single patient during follow-up and averaged over multiple either symptomatic or asymptomatic visits after adjusting LT4 dose (see Results). (B) FT3 z-scores of either symptomatic or asymptomatic presentations plotted against the averaged scores over all visits per patient. FT3 concentrations are mean-centered and units are expressed in standard deviations. This shows that the corrective FT3 difference associated with relief of self-reported hypothyroid symptoms increased progressively with increasing distance from the center. Shaded areas indicate the 95% confidence limit for the fitted regression line. (C) FT3 change relative to TSH stratified by symptomatic and asymptomatic presentations of the same patients. The intersecting points did not move along a shared trajectory between the two conditions but were significantly shifted, progressively so toward lower TSH concentrations (see Results). (D) Probability of hypothyroid symptoms as a function of circulating FT3 concentrations. The probability of the presence of hypothyroid symptoms at a given FT3 level for these patients was derived by a multilevel model accounting for intra-class and between-subject variation (see Methods and Results). The shaded area indicates the 95% confidence limit of the probability curve. The vertical ticks on the x axis indicate the observed individual values.

