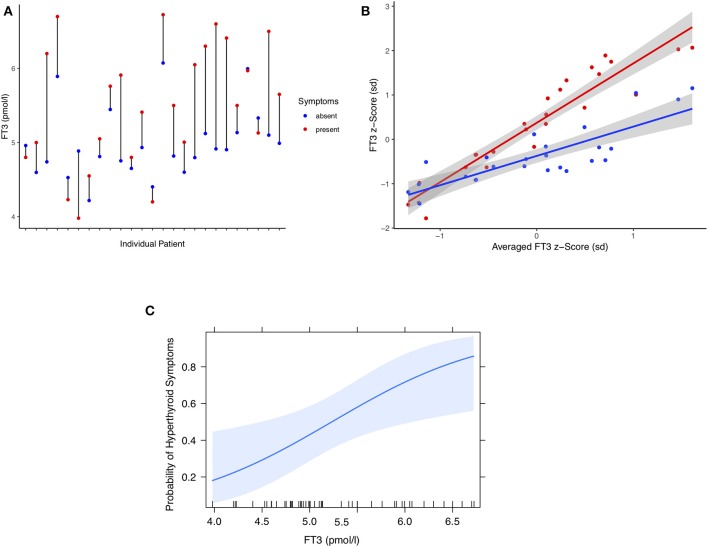
Figure 3.
(A) Difference plot of serum FT3 concentrations in 25 individual patients at either hyperthyroid or symptom-free presentations. Each point refers to the pooled measurements over multiple either symptomatic or asymptomatic visits (see Results). (B) FT3 z-scores of either symptomatic or asymptomatic presentations plotted against the averaged scores over all visits per patient. Shown are mean-centered standardized FT3 concentrations and a fitted regression line surrounded by its 95% confidence limit (shaded area). (C) Probability of hyperthyroid symptoms in these patients as a function of circulating FT3 concentrations. A multilevel model was used to estimate the probability (see Methods and Results). The shaded area indicates the 95% confidence limit of the fitted curve. The vertical ticks on the x axis indicate the observed individual values.

