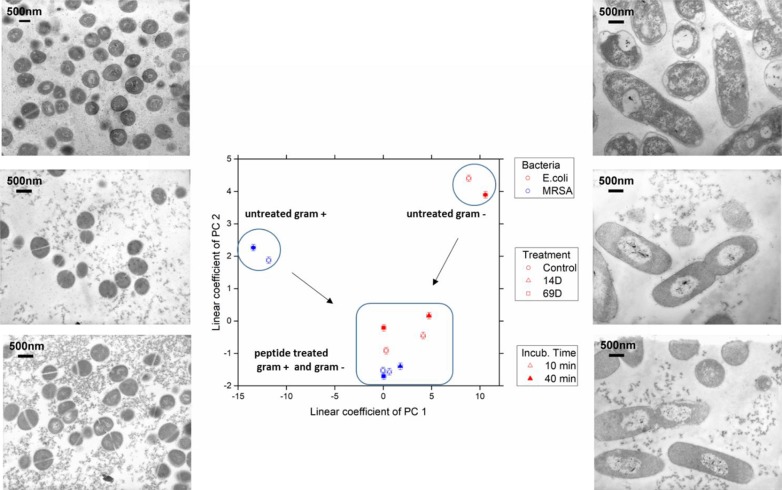
Figure 4.
The linear coefficients of the first two principle components discriminate morphological changes and modes of action. The color decodes the bacterial species, the symbol the applied treatment, and the symbol thickness the incubation time. The error estimate is calculated from duplicate measurements and found to be 0.24 for the coefficient of PC1 and 0.10 for the coefficient of PC2. The transmission electron micrographs at a 15,000 times magnification show MRSA left and Escherichia coli right hand side. Top row shows untreated cells; middle row, treatment with 14D; and lower row, treatment with 69D. Peptide treatment time was 40min.

