Figure 3.
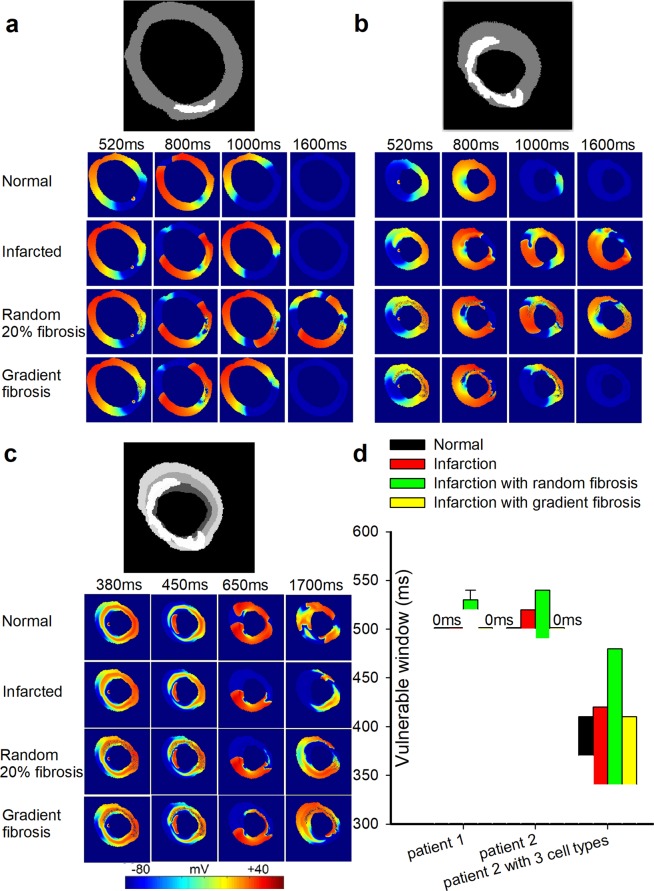
Wave propagation in the 2D actual ventricular tissue models under normal, infarcted, and MI with 20% random and gradient fibrosis conditions. (a) Structural representation and wave conduction tested with two stimuli with S1-S2 intervals of 500 ms under four conditions at different times in the tissue of patient 1, including only mid-myocardial cells. (b) Structural representation and wave conduction tested with two stimuli with S1-S2 intervals of 500 ms under four conditions at different times in the tissue of patient 2, including only mid-myocardial cells. (c) Structural representation and wave conduction under four conditions at different times in the tissue of patient 2, including three types of cells (endocardial cells, mid-myocardial cells and epicardial cells). (d) Vulnerable windows were calculated under four conditions in the tissue of patient 1 and patient 2 with only mid-myocardial cells as well as in the tissue of patient 2 with all three types of cells. A vulnerable window of 0 ms means that when the stimulus starts later than the lower bound of the S1-S2 interval, waves could conduct normally without the appearance of reentry waves. In the graph, the single line below the notation “0 ms” represents the lower bound of the S1-S2 interval where waves could conduct rather than a singular value of the vulnerable window. In addition, for conditions with no error bars shown, errors are too small to visualize. Both notations have the same meanings in the following figures.

