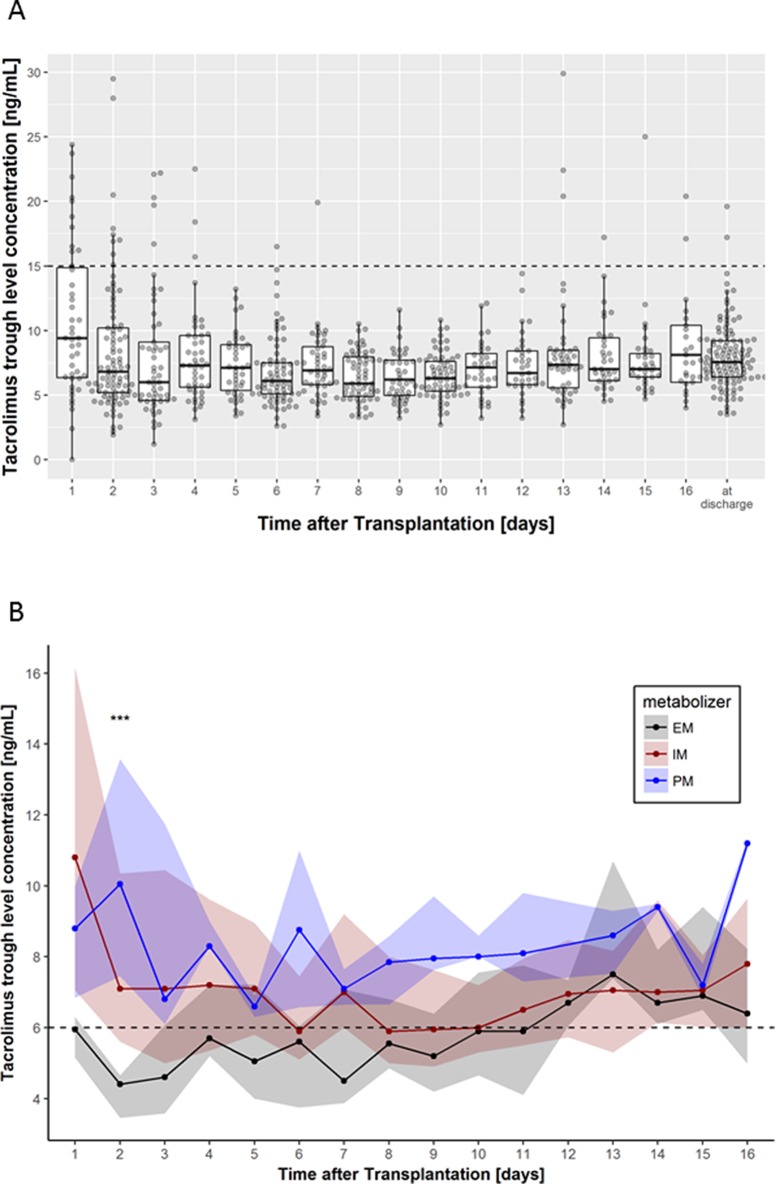
Figure 2.
(A) Box-scatter plots per day of tacrolimus trough levels measured using liquid chromatography with tandem mass spectrometry. Thick lines represent median levels, boxes represent the interquartile range from 25 and 75% percentiles, and whiskers extend from the 25 or 75% percentile to the highest (or lowest, respectively) value not further than 1.5 times the interquartile range. The supra-therapeutic level of 15 ng/ml is shown using a horizontal dashed line. (B) Median tacrolimus trough levels according to CYP3A4/5 combined genotype (EM, extensive metabolizer; IM, intermediate metabolizer, PM, poor metabolizer). Dots represent the medians per day, while shaded areas are defined by 25 and 75% quantiles. Levels below 6 ng/ml are considered to be subtherapeutic. Significance levels are shown as asterisk: ***P < 0.001.

