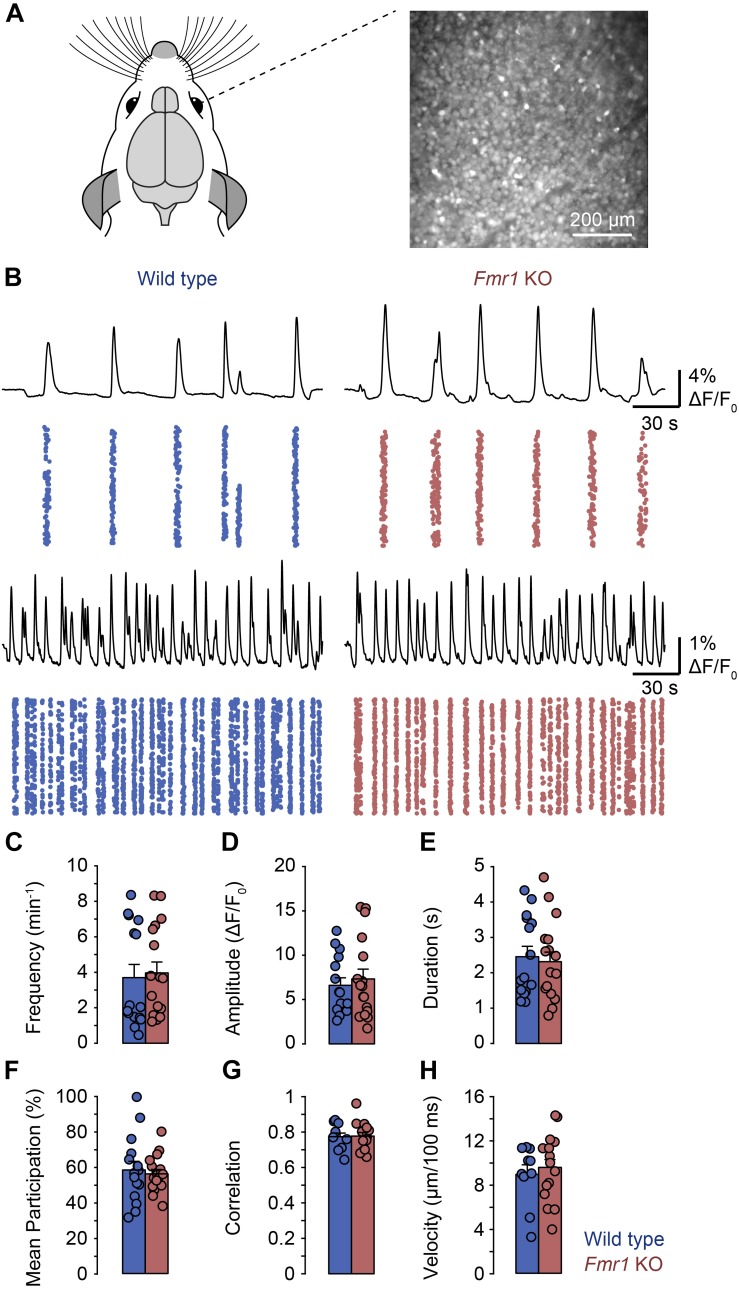
FIGURE 3.
General properties of retinal waves were not different in Fmr1 KO mice and littermate controls in whole mount recordings. (A) Experimental approach for imaging whole-mount mouse retinas (P8–P11). Retinal ganglion cells were loaded with OGB-1-AM and imaged for approximately 40 min using wide-field microscopy. (B) Example recordings of retinal waves in wild type (left) and Fmr1 KO mice (right). For each panel the top trace shows the mean activity of the field of view. The plot below shows the activity of all regions of interest (ROIs) in each field of view with each dot representing an activation in a single ROI. ROIs were generated by rasterizing each image into 10 × 10 pixel bins. The examples reflect the different frequencies of retinal waves we observed in individual retinas. (C–H) Frequency, amplitude, duration, participation, correlation, and velocity of retinal waves were unchanged in Fmr1 KO mice.

