
Figure 2.
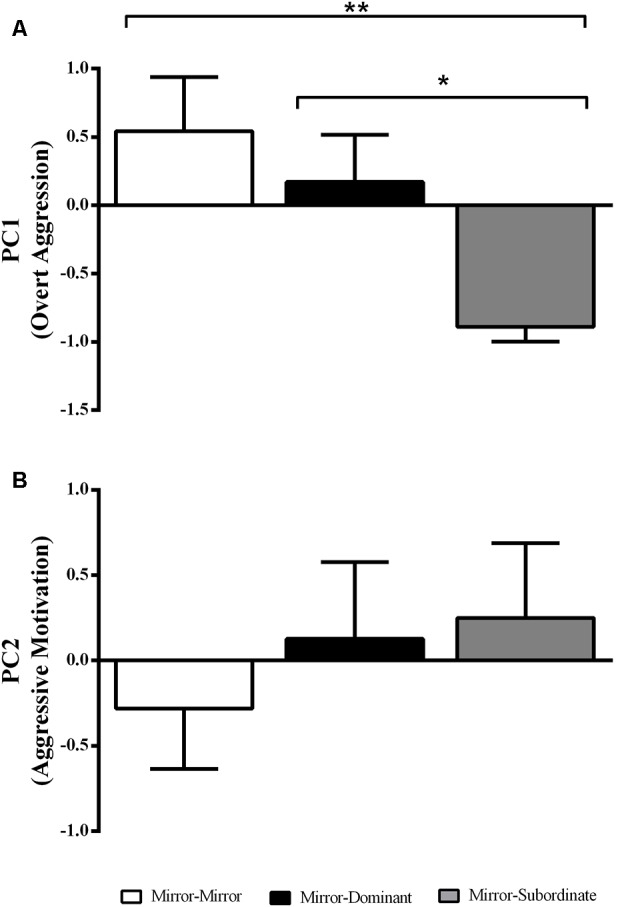
Variation in the behavioral component scores obtained with the Principal Component Analysis (PCA) for each experimental treatment. (A) PC1 interpreted as “overt aggression”; and (B) PC2 interpreted as “aggressive motivation.” *Significant difference for p < 0.05; **significant difference for p < 0.01. Results are expressed as mean ± standard error of the mean (SEM).