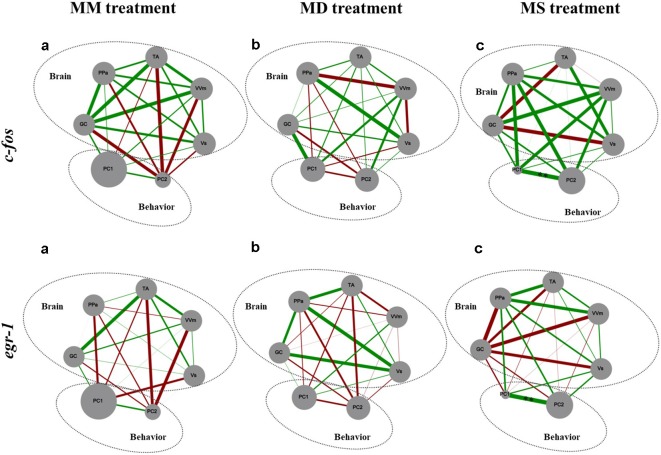
Figure 4.
Representation of the state of the SDMN and the behavior for all the experimental treatments. Node size of each brain area indicates the activity level at each network node using c-fos and egr-1 as reporters of neural activity. PC1 and PC2, component loadings obtained with the PCA of aggressive behavior were used as behavioral network nodes, where the node size corresponds to the average of principal component scores within each treatment. Line thickness indicates the strength of the connection between nodes (measured with Pearson correlation coefficients, r-value); green lines represent positive correlations; red lines represent negative correlations. GC, central gray; PPa, anterior part of the periventricular preoptic nucleus; TA, nucleus anterior tuberis; VVm, medial part of the ventral subdivision of the ventral telencephalon; Vs, supracommissural nucleus of the ventral telencephalon. PC1, first component loading interpreted as “overt aggression”; PC2, second component loading interpreted as “aggressive motivation.” **Significant correlations after p-value adjustment for p < 0.01.

