
Figure 5.
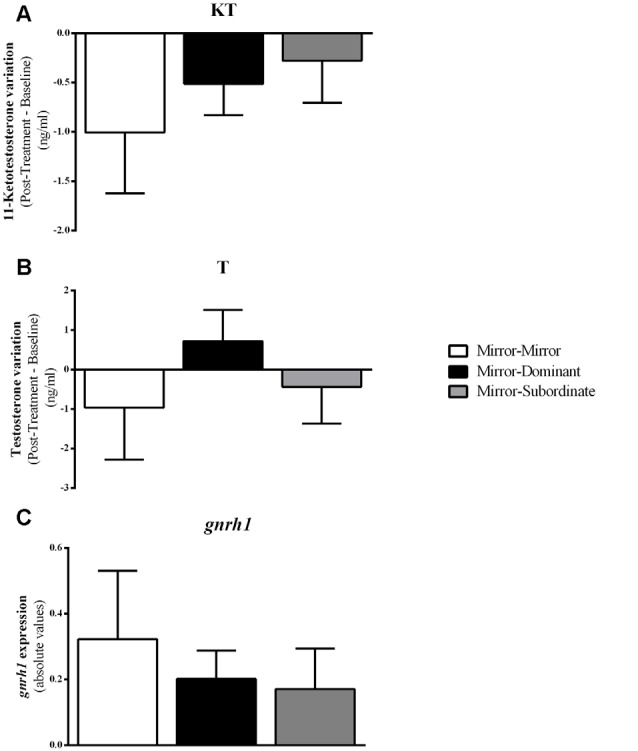
Variation in androgen levels and expression of gnrh1 in the Ppa of the focal fish for each experimental condition. (A) 11-Ketotestosterone (KT) levels; (B) Testosterone (T) levels; (C) gnrh1 expression. Results are expressed as mean ± standard error of the mean (SEM).