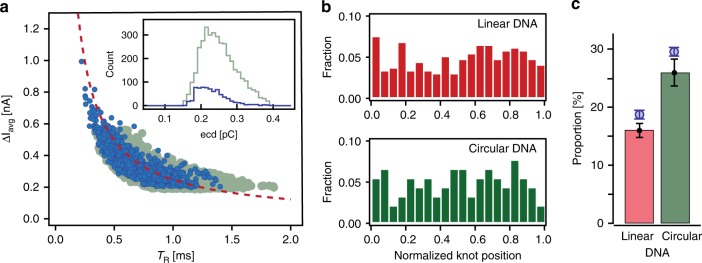
Fig. 2.
Detection of equilibrium knots. a Scatter plot of average current blockade versus translocation time (TR) for unknotted (light green circles) and knotted events (darker blue circles). All the events follow the hyperbolic curve of constant event charge deficit (ecd), i.e., constant apparent length of the molecule. Inset: histogram of ecd for knotted events (lighter green) and unknotted events (darker blue) shows similar average values (0.25 pC for unknotted and 0.23 pC for knotted events) and distributions, indicating no effects of knots on the DNA translocation speed. b Histogram for normalized center position of knots on linear (red), as well as circular (green) DNA molecules shows that the knots are randomly located along the length of the molecule. c Proportion of lambda DNA molecules with knots, in linear and circular configurations; experiment results presented with bars and simulation with circles (effective chain width wDNA = 2.4 nm). Error bars show the statistical error, assuming Poisson statistics. Source Data are provided as a Source Data file

