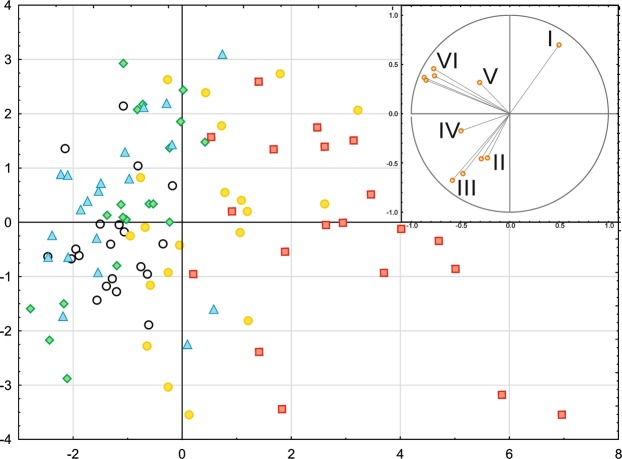
Figure 5.
The Principal Component Analysis (PCA) presenting the relationships between selected photosynthetic parameters and pigment concentrations in maize under selected macronutrient deprivation. The variants are marked with points (white circle – control, green rhombus – Ca, yellow circle – K, red square – Mg, blue triangle – P,). The variables determining the distribution of the cases: I – Anthocyanin conent, II – Transpiration rate and stomatal conductance, III – Chlorophyll and flavonol content, IV – Photosynthetic rate, V - φD0 − quantum yield (at t = 0) of energy dissipation, VI − φP0, ψE0, φE0, δR0 and φR0.

